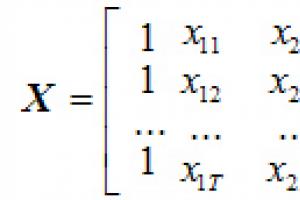
Linear regression. Using the method of least squares (LSM). Approximation of experimental data. Least squares method Least squares method in case of 3 variables
Which finds the widest application in various fields of science and practice. It can be physics, chemistry, biology, economics, sociology, psychology and so on and so forth. By the will of fate, I often have to deal with the economy, and therefore today I will arrange for you a ticket to an amazing country called Econometrics=) … How do you not want that?! It's very good there - you just have to decide! …But what you probably definitely want is to learn how to solve problems least squares. And especially diligent readers will learn to solve them not only accurately, but also VERY FAST ;-) But first general statement of the problem+ related example:
Let indicators be studied in some subject area that have a quantitative expression. At the same time, there is every reason to believe that the indicator depends on the indicator. This assumption can be both a scientific hypothesis and based on elementary common sense. Let's leave science aside, however, and explore more appetizing areas - namely, grocery stores. Denote by:
– retail space of a grocery store, sq.m.,
- annual turnover of a grocery store, million rubles.
It is quite clear that the larger the area of the store, the greater its turnover in most cases.
Suppose that after conducting observations / experiments / calculations / dancing with a tambourine, we have at our disposal numerical data: 
With grocery stores, I think everything is clear: - this is the area of the 1st store, - its annual turnover, - the area of the 2nd store, - its annual turnover, etc. By the way, it is not at all necessary to have access to classified materials - a fairly accurate assessment of the turnover can be obtained using mathematical statistics. However, do not be distracted, the course of commercial espionage is already paid =)
Tabular data can also be written in the form of points and depicted in the usual way for us. Cartesian system .
Let's answer an important question: how many points are needed for a qualitative study?
The bigger, the better. The minimum admissible set consists of 5-6 points. In addition, with a small amount of data, “abnormal” results should not be included in the sample. So, for example, a small elite store can help out orders of magnitude more than “their colleagues”, thereby distorting the general pattern that needs to be found!
If it’s quite simple, we need to choose a function , schedule which passes as close as possible to the points ![]() . Such a function is called approximating
(approximation - approximation) or theoretical function
. Generally speaking, here an obvious “pretender” immediately appears - a polynomial of high degree, the graph of which passes through ALL points. But this option is complicated, and often simply incorrect. (because the chart will “wind” all the time and poorly reflect the main trend).
. Such a function is called approximating
(approximation - approximation) or theoretical function
. Generally speaking, here an obvious “pretender” immediately appears - a polynomial of high degree, the graph of which passes through ALL points. But this option is complicated, and often simply incorrect. (because the chart will “wind” all the time and poorly reflect the main trend).
Thus, the desired function must be sufficiently simple and at the same time reflect the dependence adequately. As you might guess, one of the methods for finding such functions is called least squares. First, let's analyze its essence in a general way. Let some function approximate the experimental data: 
How to evaluate the accuracy of this approximation? Let us also calculate the differences (deviations) between the experimental and functional values (we study the drawing). The first thought that comes to mind is to estimate how big the sum is, but the problem is that the differences can be negative. (For example, ![]() )
and deviations as a result of such summation will cancel each other out. Therefore, as an estimate of the accuracy of the approximation, it suggests itself to take the sum modules deviations:
)
and deviations as a result of such summation will cancel each other out. Therefore, as an estimate of the accuracy of the approximation, it suggests itself to take the sum modules deviations:
![]() or in folded form: (suddenly, who doesn’t know: is the sum icon, and is an auxiliary variable-“counter”, which takes values from 1 to ).
or in folded form: (suddenly, who doesn’t know: is the sum icon, and is an auxiliary variable-“counter”, which takes values from 1 to ).
By approximating the experimental points with different functions, we will obtain different values of , and it is obvious that where this sum is smaller, that function is more accurate.
Such a method exists and is called least modulus method. However, in practice it has become much more widespread. least square method, in which possible negative values are eliminated not by the modulus, but by squaring the deviations:
![]() , after which efforts are directed to the selection of such a function that the sum of the squared deviations
, after which efforts are directed to the selection of such a function that the sum of the squared deviations ![]() was as small as possible. Actually, hence the name of the method.
was as small as possible. Actually, hence the name of the method.
And now we return to another important point: as noted above, the selected function should be quite simple - but there are also many such functions: linear , hyperbolic, exponential, logarithmic, quadratic etc. And, of course, here I would immediately like to "reduce the field of activity." What class of functions to choose for research? Primitive but effective technique:
- The easiest way to draw points ![]() on the drawing and analyze their location. If they tend to be in a straight line, then you should look for straight line equation
on the drawing and analyze their location. If they tend to be in a straight line, then you should look for straight line equation ![]() with optimal values and . In other words, the task is to find SUCH coefficients - so that the sum of the squared deviations is the smallest.
with optimal values and . In other words, the task is to find SUCH coefficients - so that the sum of the squared deviations is the smallest.
If the points are located, for example, along hyperbole, then it is clear that the linear function will give a poor approximation. In this case, we are looking for the most "favorable" coefficients for the hyperbola equation ![]() - those that give the minimum sum of squares
- those that give the minimum sum of squares  .
.
Now notice that in both cases we are talking about functions of two variables, whose arguments are searched dependency options:
And in essence, we need to solve a standard problem - to find minimum of a function of two variables.
Recall our example: suppose that the "shop" points tend to be located in a straight line and there is every reason to believe the presence linear dependence turnover from the trading area. Let's find SUCH coefficients "a" and "be" so that the sum of squared deviations ![]() was the smallest. Everything as usual - first partial derivatives of the 1st order. According to linearity rule you can differentiate right under the sum icon:
was the smallest. Everything as usual - first partial derivatives of the 1st order. According to linearity rule you can differentiate right under the sum icon: 
If you want to use this information for an essay or a term paper, I will be very grateful for the link in the list of sources, you will not find such detailed calculations anywhere: 
Let's make a standard system: 
We reduce each equation by a “two” and, in addition, “break apart” the sums: 
Note
: independently analyze why "a" and "be" can be taken out of the sum icon. By the way, formally this can be done with the sum![]()
Let's rewrite the system in an "applied" form: 
after which the algorithm for solving our problem begins to be drawn:
Do we know the coordinates of the points? We know. Sums ![]() can we find? Easily. We compose the simplest system of two linear equations with two unknowns("a" and "beh"). We solve the system, for example, Cramer's method, resulting in a stationary point . Checking sufficient condition for an extremum, we can verify that at this point the function
can we find? Easily. We compose the simplest system of two linear equations with two unknowns("a" and "beh"). We solve the system, for example, Cramer's method, resulting in a stationary point . Checking sufficient condition for an extremum, we can verify that at this point the function ![]() reaches precisely minimum. Verification is associated with additional calculations and therefore we will leave it behind the scenes. (if necessary, the missing frame can be viewed). We draw the final conclusion:
reaches precisely minimum. Verification is associated with additional calculations and therefore we will leave it behind the scenes. (if necessary, the missing frame can be viewed). We draw the final conclusion:
Function ![]() the best way (at least compared to any other linear function) brings experimental points closer
the best way (at least compared to any other linear function) brings experimental points closer ![]() . Roughly speaking, its graph passes as close as possible to these points. In tradition econometrics the resulting approximating function is also called paired linear regression equation
.
. Roughly speaking, its graph passes as close as possible to these points. In tradition econometrics the resulting approximating function is also called paired linear regression equation
.
The problem under consideration is of great practical importance. In the situation with our example, the equation ![]() allows you to predict what kind of turnover ("yig") will be at the store with one or another value of the selling area (one or another meaning of "x"). Yes, the resulting forecast will be only a forecast, but in many cases it will turn out to be quite accurate.
allows you to predict what kind of turnover ("yig") will be at the store with one or another value of the selling area (one or another meaning of "x"). Yes, the resulting forecast will be only a forecast, but in many cases it will turn out to be quite accurate.
I will analyze just one problem with "real" numbers, since there are no difficulties in it - all calculations are at the level of the school curriculum in grades 7-8. In 95 percent of cases, you will be asked to find just a linear function, but at the very end of the article I will show that it is no more difficult to find the equations for the optimal hyperbola, exponent, and some other functions.
In fact, it remains to distribute the promised goodies - so that you learn how to solve such examples not only accurately, but also quickly. We carefully study the standard:
Task
As a result of studying the relationship between two indicators, the following pairs of numbers were obtained: 
Using the least squares method, find the linear function that best approximates the empirical (experienced) data. Make a drawing on which, in a Cartesian rectangular coordinate system, plot experimental points and a graph of the approximating function ![]() . Find the sum of squared deviations between empirical and theoretical values. Find out if the function is better (in terms of the least squares method) approximate experimental points.
. Find the sum of squared deviations between empirical and theoretical values. Find out if the function is better (in terms of the least squares method) approximate experimental points.
Note that "x" values are natural values, and this has a characteristic meaningful meaning, which I will talk about a little later; but they, of course, can be fractional. In addition, depending on the content of a particular task, both "X" and "G" values can be fully or partially negative. Well, we have been given a “faceless” task, and we start it solution:
We find the coefficients of the optimal function as a solution to the system: 
For the purposes of a more compact notation, the “counter” variable can be omitted, since it is already clear that the summation is carried out from 1 to .
It is more convenient to calculate the required amounts in a tabular form: 
Calculations can be carried out on a microcalculator, but it is much better to use Excel - both faster and without errors; watch a short video:
Thus, we get the following system:![]()
Here you can multiply the second equation by 3 and subtract the 2nd from the 1st equation term by term. But this is luck - in practice, systems are often not gifted, and in such cases it saves Cramer's method:
, so the system has a unique solution.

Let's do a check. I understand that I don’t want to, but why skip mistakes where you can absolutely not miss them? Substitute the found solution into the left side of each equation of the system:
The right parts of the corresponding equations are obtained, which means that the system is solved correctly.
Thus, the desired approximating function: – from all linear functions experimental data is best approximated by it.
Unlike straight
dependence of the store's turnover on its area, the found dependence is reverse
(principle "the more - the less"), and this fact is immediately revealed by the negative angular coefficient. Function ![]() informs us that with an increase in a certain indicator by 1 unit, the value of the dependent indicator decreases average by 0.65 units. As they say, the higher the price of buckwheat, the less sold.
informs us that with an increase in a certain indicator by 1 unit, the value of the dependent indicator decreases average by 0.65 units. As they say, the higher the price of buckwheat, the less sold.
To plot the approximating function, we find two of its values:
and execute the drawing: 
The constructed line is called trend line
(namely, a linear trend line, i.e. in the general case, a trend is not necessarily a straight line). Everyone is familiar with the expression "to be in trend", and I think that this term does not need additional comments.
Calculate the sum of squared deviations ![]() between empirical and theoretical values. Geometrically, this is the sum of the squares of the lengths of the "crimson" segments (two of which are so small you can't even see them).
between empirical and theoretical values. Geometrically, this is the sum of the squares of the lengths of the "crimson" segments (two of which are so small you can't even see them).
Let's summarize the calculations in a table: 
They can again be carried out manually, just in case I will give an example for the 1st point: ![]()
but it is much more efficient to do the already known way:
Let's repeat: what is the meaning of the result? From all linear functions function ![]() the exponent is the smallest, that is, it is the best approximation in its family. And here, by the way, the final question of the problem is not accidental: what if the proposed exponential function
the exponent is the smallest, that is, it is the best approximation in its family. And here, by the way, the final question of the problem is not accidental: what if the proposed exponential function ![]() will it be better to approximate the experimental points?
will it be better to approximate the experimental points?
Let's find the corresponding sum of squared deviations - to distinguish them, I will designate them with the letter "epsilon". The technique is exactly the same: 
And again for every fire calculation for the 1st point: 
In Excel, we use the standard function EXP (Syntax can be found in Excel Help).
Conclusion: , so the exponential function approximates the experimental points worse than the straight line ![]() .
.
But it should be noted here that "worse" is doesn't mean yet, what is wrong. Now I built a graph of this exponential function - and it also passes close to the points ![]() - so much so that without an analytical study it is difficult to say which function is more accurate.
- so much so that without an analytical study it is difficult to say which function is more accurate.
This completes the solution, and I return to the question of the natural values of the argument. In various studies, as a rule, economic or sociological, months, years or other equal time intervals are numbered with natural "X". Consider, for example, such a problem.
Example.
Experimental data on the values of variables X And at are given in the table.
As a result of their alignment, the function ![]()
Using least square method, approximate these data with a linear dependence y=ax+b(find options A And b). Find out which of the two lines is better (in the sense of the least squares method) aligns the experimental data. Make a drawing.
The essence of the method of least squares (LSM).
The problem is to find the linear dependence coefficients for which the function of two variables A And b
![]() takes the smallest value. That is, given the data A And b the sum of the squared deviations of the experimental data from the found straight line will be the smallest. This is the whole point of the least squares method.
takes the smallest value. That is, given the data A And b the sum of the squared deviations of the experimental data from the found straight line will be the smallest. This is the whole point of the least squares method.
Thus, the solution of the example is reduced to finding the extremum of a function of two variables.
Derivation of formulas for finding coefficients.
A system of two equations with two unknowns is compiled and solved. Finding partial derivatives of functions ![]() by variables A And b, we equate these derivatives to zero.
by variables A And b, we equate these derivatives to zero. 
We solve the resulting system of equations by any method (for example substitution method or Cramer's method) and obtain formulas for finding the coefficients using the least squares method (LSM). 
With data A And b function ![]() takes the smallest value. The proof of this fact is given below the text at the end of the page.
takes the smallest value. The proof of this fact is given below the text at the end of the page.
That's the whole method of least squares. Formula for finding the parameter a contains the sums ,,, and the parameter n- amount of experimental data. The values of these sums are recommended to be calculated separately. Coefficient b found after calculation a.
It's time to remember the original example.
Solution.
In our example n=5. We fill in the table for the convenience of calculating the amounts that are included in the formulas of the required coefficients. 
The values in the fourth row of the table are obtained by multiplying the values of the 2nd row by the values of the 3rd row for each number i.
The values in the fifth row of the table are obtained by squaring the values of the 2nd row for each number i.
The values of the last column of the table are the sums of the values across the rows.
We use the formulas of the least squares method to find the coefficients A And b. We substitute in them the corresponding values from the last column of the table: 
Hence, y=0.165x+2.184 is the desired approximating straight line.
It remains to find out which of the lines y=0.165x+2.184 or ![]() better approximates the original data, i.e. to make an estimate using the least squares method.
better approximates the original data, i.e. to make an estimate using the least squares method.
Estimation of the error of the method of least squares.
To do this, you need to calculate the sums of squared deviations of the original data from these lines ![]() And
And ![]() , a smaller value corresponds to a line that better approximates the original data in terms of the least squares method.
, a smaller value corresponds to a line that better approximates the original data in terms of the least squares method. 
Since , then the line y=0.165x+2.184 approximates the original data better.
Graphic illustration of the least squares method (LSM).
Everything looks great on the charts. The red line is the found line y=0.165x+2.184, the blue line is ![]() , the pink dots are the original data.
, the pink dots are the original data.

In practice, when modeling various processes - in particular, economic, physical, technical, social - one or another method of calculating the approximate values of functions from their known values at some fixed points is widely used.
Problems of approximation of functions of this kind often arise:
when constructing approximate formulas for calculating the values of the characteristic quantities of the process under study according to the tabular data obtained as a result of the experiment;
in numerical integration, differentiation, solving differential equations, etc.;
if it is necessary to calculate the values of functions at intermediate points of the considered interval;
when determining the values of the characteristic quantities of the process outside the interval under consideration, in particular, when forecasting.
If, in order to model a certain process specified by a table, a function is constructed that approximately describes this process based on the least squares method, it will be called an approximating function (regression), and the task of constructing approximating functions itself will be an approximation problem.
This article discusses the possibilities of the MS Excel package for solving such problems, in addition, methods and techniques for constructing (creating) regressions for tabularly given functions (which is the basis of regression analysis) are given.
There are two options for building regressions in Excel.
Adding selected regressions (trendlines) to a chart built on the basis of a data table for the studied process characteristic (available only if a chart is built);
Using the built-in statistical functions of the Excel worksheet, which allows you to get regressions (trend lines) directly from the source data table.
Adding Trendlines to a Chart
For a table of data describing a certain process and represented by a diagram, Excel has an effective regression analysis tool that allows you to:
build on the basis of the least squares method and add to the diagram five types of regressions that model the process under study with varying degrees of accuracy;
add an equation of the constructed regression to the diagram;
determine the degree of compliance of the selected regression with the data displayed on the chart.
Based on the chart data, Excel allows you to get linear, polynomial, logarithmic, exponential, exponential types of regressions, which are given by the equation:
y = y(x)
where x is an independent variable, which often takes the values of a sequence of natural numbers (1; 2; 3; ...) and produces, for example, a countdown of the time of the process under study (characteristics).
1 . Linear regression is good at modeling features that increase or decrease at a constant rate. This is the simplest model of the process under study. It is built according to the equation:
y=mx+b
where m is the tangent of the slope of the linear regression to the x-axis; b - coordinate of the point of intersection of the linear regression with the y-axis.
2 . A polynomial trendline is useful for describing characteristics that have several distinct extremes (highs and lows). The choice of the degree of the polynomial is determined by the number of extrema of the characteristic under study. Thus, a polynomial of the second degree can well describe a process that has only one maximum or minimum; polynomial of the third degree - no more than two extrema; polynomial of the fourth degree - no more than three extrema, etc.
In this case, the trend line is built in accordance with the equation:
y = c0 + c1x + c2x2 + c3x3 + c4x4 + c5x5 + c6x6
where the coefficients c0, c1, c2,... c6 are constants whose values are determined during construction.
3 . The logarithmic trend line is successfully used in modeling characteristics, the values of which change rapidly at first, and then gradually stabilize.
y = c ln(x) + b
4 . The power trend line gives good results if the values of the studied dependence are characterized by a constant change in the growth rate. An example of such a dependence can serve as a graph of uniformly accelerated movement of the car. If there are zero or negative values in the data, you cannot use a power trend line.
It is built in accordance with the equation:
y = cxb
where the coefficients b, c are constants.
5 . An exponential trendline should be used if the rate of change in the data is continuously increasing. For data containing zero or negative values, this kind of approximation is also not applicable.
It is built in accordance with the equation:
y=cebx
where the coefficients b, c are constants.
When selecting a trend line, Excel automatically calculates the value of R2, which characterizes the accuracy of the approximation: the closer the R2 value is to one, the more reliably the trend line approximates the process under study. If necessary, the value of R2 can always be displayed on the diagram.
Determined by the formula:

To add a trend line to a data series:
activate the chart built on the basis of the data series, i.e., click within the chart area. The Chart item will appear in the main menu;
after clicking on this item, a menu will appear on the screen, in which you should select the Add trend line command.
The same actions are easily implemented if you hover over the graph corresponding to one of the data series and right-click; in the context menu that appears, select the Add trend line command. The Trendline dialog box will appear on the screen with the Type tab opened (Fig. 1).

After that you need:
On the Type tab, select the required trend line type (Linear is selected by default). For the Polynomial type, in the Degree field, specify the degree of the selected polynomial.
1 . The Built on Series field lists all the data series in the chart in question. To add a trendline to a specific data series, select its name in the Built on series field.

If necessary, by going to the Parameters tab (Fig. 2), you can set the following parameters for the trend line:
change the name of the trend line in the Name of the approximating (smoothed) curve field.
set the number of periods (forward or backward) for the forecast in the Forecast field;
display the equation of the trend line in the chart area, for which you should enable the checkbox show the equation on the chart;
display the value of the approximation reliability R2 in the diagram area, for which you should enable the checkbox put the value of the approximation reliability (R^2) on the diagram;
set the point of intersection of the trend line with the Y-axis, for which you should enable the checkbox for the intersection of the curve with the Y-axis at a point;
click the OK button to close the dialog box.
There are three ways to start editing an already built trend line:
use the Selected trend line command from the Format menu, after selecting the trend line;
select the Format Trendline command from the context menu, which is called by right-clicking on the trendline;
by double clicking on the trend line.
The Format Trendline dialog box will appear on the screen (Fig. 3), containing three tabs: View, Type, Parameters, and the contents of the last two completely coincide with the similar tabs of the Trendline dialog box (Fig. 1-2). On the View tab, you can set the line type, its color and thickness.

To delete an already constructed trend line, select the trend line to be deleted and press the Delete key.
The advantages of the considered regression analysis tool are:
the relative ease of plotting a trend line on charts without creating a data table for it;
a fairly wide list of types of proposed trend lines, and this list includes the most commonly used types of regression;
the possibility of predicting the behavior of the process under study for an arbitrary (within common sense) number of steps forward, as well as back;
the possibility of obtaining the equation of the trend line in an analytical form;
the possibility, if necessary, of obtaining an assessment of the reliability of the approximation.
The disadvantages include the following points:
the construction of a trend line is carried out only if there is a chart built on a series of data;
the process of generating data series for the characteristic under study based on the trend line equations obtained for it is somewhat cluttered: the desired regression equations are updated with each change in the values of the original data series, but only within the chart area, while the data series formed on the basis of the old line equation trend, remains unchanged;
In PivotChart reports, when you change the chart view or the associated PivotTable report, existing trendlines are not retained, so you must ensure that the layout of the report meets your requirements before you draw trendlines or otherwise format the PivotChart report.
Trend lines can be added to data series presented on charts such as a graph, histogram, flat non-normalized area charts, bar, scatter, bubble and stock charts.
You cannot add trendlines to data series on 3-D, Standard, Radar, Pie, and Donut charts.
Using Built-in Excel Functions
Excel also provides a regression analysis tool for plotting trendlines outside the chart area. A number of statistical worksheet functions can be used for this purpose, but all of them allow you to build only linear or exponential regressions.
Excel has several functions for building linear regression, in particular:
SLOPE and CUT.
TREND;
As well as several functions for constructing an exponential trend line, in particular:
LGRFPapprox.
It should be noted that the techniques for constructing regressions using the TREND and GROWTH functions are practically the same. The same can be said about the pair of functions LINEST and LGRFPRIBL. For these four functions, when creating a table of values, Excel features such as array formulas are used, which somewhat clutters up the process of building regressions. We also note that the construction of a linear regression, in our opinion, is easiest to implement using the SLOPE and INTERCEPT functions, where the first of them determines the slope of the linear regression, and the second determines the segment cut off by the regression on the y-axis.
The advantages of the built-in functions tool for regression analysis are:
a fairly simple process of the same type of formation of data series of the characteristic under study for all built-in statistical functions that set trend lines;
a standard technique for constructing trend lines based on the generated data series;
the ability to predict the behavior of the process under study for the required number of steps forward or backward.
And the disadvantages include the fact that Excel does not have built-in functions for creating other (except linear and exponential) types of trend lines. This circumstance often does not allow choosing a sufficiently accurate model of the process under study, as well as obtaining forecasts close to reality. In addition, when using the TREND and GROW functions, the equations of the trend lines are not known.
It should be noted that the authors did not set the goal of the article to present the course of regression analysis with varying degrees of completeness. Its main task is to show the capabilities of the Excel package in solving approximation problems using specific examples; demonstrate what effective tools Excel has for building regressions and forecasting; illustrate how relatively easily such problems can be solved even by a user who does not have deep knowledge of regression analysis.
Examples of solving specific problems
Consider the solution of specific problems using the listed tools of the Excel package.
Task 1
With a table of data on the profit of a motor transport enterprise for 1995-2002. you need to do the following.
Build a chart.
Add linear and polynomial (quadratic and cubic) trend lines to the chart.
Using the trend line equations, obtain tabular data on the profit of the enterprise for each trend line for 1995-2004.
Make a profit forecast for the enterprise for 2003 and 2004.
The solution of the problem

In the range of cells A4:C11 of the Excel worksheet, we enter the worksheet shown in Fig. 4.
Having selected the range of cells B4:C11, we build a chart.
We activate the constructed chart and, using the method described above, after selecting the type of trend line in the Trend Line dialog box (see Fig. 1), we alternately add linear, quadratic and cubic trend lines to the chart. In the same dialog box, open the Parameters tab (see Fig. 2), in the Name of the approximating (smoothed) curve field, enter the name of the trend to be added, and in the Forecast forward for: periods field, set the value 2, since it is planned to make a profit forecast for two years ahead. To display the regression equation and the value of the approximation reliability R2 in the diagram area, enable the check boxes Show the equation on the screen and place the value of the approximation reliability (R^2) on the diagram. For better visual perception, we change the type, color and thickness of the plotted trend lines, for which we use the View tab of the Trend Line Format dialog box (see Fig. 3). The resulting chart with added trend lines is shown in fig. 5.
To obtain tabular data on the profit of the enterprise for each trend line for 1995-2004. Let's use the equations of the trend lines presented in fig. 5. To do this, in the cells of the D3:F3 range, enter textual information about the type of the selected trend line: Linear trend, Quadratic trend, Cubic trend. Next, enter the linear regression formula in cell D4 and, using the fill marker, copy this formula with relative references to the range of cells D5:D13. It should be noted that each cell with a linear regression formula from the range of cells D4:D13 has a corresponding cell from the range A4:A13 as an argument. Similarly, for quadratic regression, the cell range E4:E13 is filled, and for cubic regression, the cell range F4:F13 is filled. Thus, a forecast was made for the profit of the enterprise for 2003 and 2004. with three trends. The resulting table of values is shown in fig. 6.


Task 2
Build a chart.
Add logarithmic, exponential and exponential trend lines to the chart.
Derive the equations of the obtained trend lines, as well as the values of the approximation reliability R2 for each of them.
Using the trend line equations, obtain tabular data on the profit of the enterprise for each trend line for 1995-2002.
Make a profit forecast for the business for 2003 and 2004 using these trend lines.
The solution of the problem
Following the methodology given in solving problem 1, we obtain a diagram with added logarithmic, exponential and exponential trend lines (Fig. 7). Further, using the obtained trend line equations, we fill in the table of values for the profit of the enterprise, including the predicted values for 2003 and 2004. (Fig. 8).


On fig. 5 and fig. it can be seen that the model with a logarithmic trend corresponds to the lowest value of the approximation reliability
R2 = 0.8659
The highest values of R2 correspond to models with a polynomial trend: quadratic (R2 = 0.9263) and cubic (R2 = 0.933).
Task 3
With a table of data on the profit of a motor transport enterprise for 1995-2002, given in task 1, you must perform the following steps.
Get data series for linear and exponential trendlines using the TREND and GROW functions.
Using the TREND and GROWTH functions, make a profit forecast for the enterprise for 2003 and 2004.
For the initial data and the received data series, construct a diagram.
The solution of the problem
Let's use the worksheet of task 1 (see Fig. 4). Let's start with the TREND function:
select the range of cells D4:D11, which should be filled with the values of the TREND function corresponding to the known data on the profit of the enterprise;
call the Function command from the Insert menu. In the Function Wizard dialog box that appears, select the TREND function from the Statistical category, and then click the OK button. The same operation can be performed by pressing the button (Insert function) of the standard toolbar.
In the Function Arguments dialog box that appears, enter the range of cells C4:C11 in the Known_values_y field; in the Known_values_x field - the range of cells B4:B11;
to make the entered formula an array formula, use the key combination + + .
The formula we entered in the formula bar will look like: =(TREND(C4:C11;B4:B11)).
As a result, the range of cells D4:D11 is filled with the corresponding values of the TREND function (Fig. 9).

To make a forecast of the company's profit for 2003 and 2004. necessary:
select the range of cells D12:D13, where the values predicted by the TREND function will be entered.
call the TREND function and in the Function Arguments dialog box that appears, enter in the Known_values_y field - the range of cells C4:C11; in the Known_values_x field - the range of cells B4:B11; and in the field New_values_x - the range of cells B12:B13.
turn this formula into an array formula using the keyboard shortcut Ctrl + Shift + Enter.
The entered formula will look like: =(TREND(C4:C11;B4:B11;B12:B13)), and the range of cells D12:D13 will be filled with the predicted values of the TREND function (see Fig. 9).
Similarly, a data series is filled using the GROWTH function, which is used in the analysis of nonlinear dependencies and works exactly the same as its linear counterpart TREND.
Figure 10 shows the table in formula display mode.


For the initial data and the obtained data series, the diagram shown in fig. eleven.
Task 4
With a table of data on the receipt of applications for services by the dispatching service of a motor transport enterprise for the period from the 1st to the 11th day of the current month, the following actions must be performed.
Obtain data series for linear regression: using the SLOPE and INTERCEPT functions; using the LINEST function.
Retrieve a data series for exponential regression using the LYFFPRIB function.
Using the above functions, make a forecast about the receipt of applications to the dispatch service for the period from the 12th to the 14th day of the current month.
For the original and received data series, construct a diagram.
The solution of the problem
Note that, unlike the TREND and GROW functions, none of the functions listed above (SLOPE, INTERCEPTION, LINEST, LGRFPRIB) are regressions. These functions play only an auxiliary role, determining the necessary regression parameters.
For linear and exponential regressions built using the SLOPE, INTERCEPT, LINEST, LGRFINB functions, the appearance of their equations is always known, in contrast to the linear and exponential regressions corresponding to the TREND and GROWTH functions.
1 . Let's build a linear regression that has the equation:
y=mx+b
using the SLOPE and INTERCEPT functions, with the slope of the regression m being determined by the SLOPE function, and the constant term b - by the INTERCEPT function.
To do this, we perform the following actions:
enter the source table in the range of cells A4:B14;
the value of the parameter m will be determined in cell C19. Select from the Statistical category the Slope function; enter the range of cells B4:B14 in the known_values_y field and the range of cells A4:A14 in the known_values_x field. The formula will be entered into cell C19: =SLOPE(B4:B14;A4:A14);
using a similar method, the value of the parameter b in cell D19 is determined. And its content will look like this: = INTERCEPT(B4:B14;A4:A14). Thus, the values of the parameters m and b, necessary for constructing a linear regression, will be stored, respectively, in cells C19, D19;
then we enter the linear regression formula in cell C4 in the form: = $ C * A4 + $ D. In this formula, cells C19 and D19 are written with absolute references (the cell address should not change with possible copying). The absolute reference sign $ can be typed either from the keyboard or using the F4 key, after placing the cursor on the cell address. Using the fill handle, copy this formula to the range of cells C4:C17. We get the desired data series (Fig. 12). Due to the fact that the number of requests is an integer, you should set the number format on the Number tab of the Cell Format window with the number of decimal places to 0.
2 . Now let's build a linear regression given by the equation:
y=mx+b
using the LINEST function.
For this:
enter the LINEST function as an array formula into the range of cells C20:D20: =(LINEST(B4:B14;A4:A14)). As a result, we get the value of the parameter m in cell C20, and the value of the parameter b in cell D20;
enter the formula in cell D4: =$C*A4+$D;
copy this formula using the fill marker to the range of cells D4:D17 and get the desired data series.
3 . We build an exponential regression that has the equation:
with the help of the LGRFPRIBL function, it is performed similarly:
in the range of cells C21:D21, enter the function LGRFPRIBL as an array formula: =( LGRFPRIBL (B4:B14;A4:A14)). In this case, the value of the parameter m will be determined in cell C21, and the value of the parameter b will be determined in cell D21;
the formula is entered into cell E4: =$D*$C^A4;
using the fill marker, this formula is copied to the range of cells E4:E17, where the data series for exponential regression will be located (see Fig. 12).

On fig. 13 shows a table where we can see the functions we use with the necessary cell ranges, as well as formulas.
Value R 2 called determination coefficient.
The task of constructing a regression dependence is to find the vector of coefficients m of the model (1) at which the coefficient R takes the maximum value.
To assess the significance of R, Fisher's F-test is used, calculated by the formula

Where n- sample size (number of experiments);
k is the number of model coefficients.
If F exceeds some critical value for the data n And k and the accepted confidence level, then the value of R is considered significant. Tables of critical values of F are given in reference books on mathematical statistics.
Thus, the significance of R is determined not only by its value, but also by the ratio between the number of experiments and the number of coefficients (parameters) of the model. Indeed, the correlation ratio for n=2 for a simple linear model is 1 (through 2 points on the plane, you can always draw a single straight line). However, if the experimental data are random variables, such a value of R should be trusted with great care. Usually, in order to obtain a significant R and reliable regression, it is aimed at ensuring that the number of experiments significantly exceeds the number of model coefficients (n>k).
To build a linear regression model, you must:
1) prepare a list of n rows and m columns containing the experimental data (column containing the output value Y must be either first or last in the list); for example, let's take the data of the previous task, adding a column called "period number", numbering the numbers of periods from 1 to 12. (these will be the values X)
2) go to menu Data/Data Analysis/Regression

If the "Data Analysis" item in the "Tools" menu is missing, then you should go to the "Add-Ins" item of the same menu and check the "Analysis Package" box.
3) in the "Regression" dialog box, set:
input interval Y;
input interval X;
output interval - the upper left cell of the interval in which the calculation results will be placed (it is recommended to place it on a new worksheet);

4) click "Ok" and analyze the results.
If some physical quantity depends on another quantity, then this dependence can be investigated by measuring y at different values of x. As a result of measurements, a series of values is obtained:
x 1 , x 2 , ..., x i , ... , x n ;
y 1 , y 2 , ..., y i , ... , y n .
Based on the data of such an experiment, it is possible to plot the dependence y = ƒ(x). The resulting curve makes it possible to judge the form of the function ƒ(x). However, the constant coefficients that enter into this function remain unknown. They can be determined using the least squares method. The experimental points, as a rule, do not lie exactly on the curve. The method of least squares requires that the sum of the squared deviations of the experimental points from the curve, i.e. 2 was the smallest.
In practice, this method is most often (and most simply) used in the case of a linear relationship, i.e. When
y=kx or y = a + bx.
Linear dependence is very widespread in physics. And even when the dependence is non-linear, they usually try to build a graph in such a way as to get a straight line. For example, if it is assumed that the refractive index of glass n is related to the wavelength λ of the light wave by the relation n = a + b/λ 2 , then the dependence of n on λ -2 is plotted on the graph.
Consider the dependence y=kx(straight line passing through the origin). Let us compose the value φ the sum of the squared deviations of our points from the straight line
The value of φ is always positive and turns out to be the smaller, the closer our points lie to the straight line. The method of least squares states that for k one should choose such a value at which φ has a minimum
![]()
or
(19)
The calculation shows that the root-mean-square error in determining the value of k is equal to
 , (20)
where n is the number of dimensions.
Let us now consider a somewhat more difficult case, when the points must satisfy the formula y = a + bx(a straight line not passing through the origin).
The task is to find the best values of a and b from the given set of values x i , y i .
Again we compose a quadratic form φ equal to the sum of the squared deviations of the points x i , y i from the straight line
![]()
and find the values a and b for which φ has a minimum
![]() ;
;
![]() .
.
The joint solution of these equations gives
![]() (21)
(21)
The root-mean-square errors of determining a and b are equal
 (23)
(23)
 . (24)
When processing the measurement results by this method, it is convenient to summarize all the data in a table in which all the amounts included in formulas (19)(24) are preliminarily calculated. The forms of these tables are shown in the examples below.
Example 1 The basic equation of the dynamics of rotational motion ε = M/J (a straight line passing through the origin) was studied. For various values of the moment M, the angular acceleration ε of a certain body was measured. It is required to determine the moment of inertia of this body. The results of measurements of the moment of force and angular acceleration are listed in the second and third columns tables 5.
Table 5
| n | M, N m | ε, s-1 | M2 | M ε | ε - kM | (ε - kM) 2 |
| 1 | 1.44 | 0.52 | 2.0736 | 0.7488 | 0.039432 | 0.001555 |
| 2 | 3.12 | 1.06 | 9.7344 | 3.3072 | 0.018768 | 0.000352 |
| 3 | 4.59 | 1.45 | 21.0681 | 6.6555 | -0.08181 | 0.006693 |
| 4 | 5.90 | 1.92 | 34.81 | 11.328 | -0.049 | 0.002401 |
| 5 | 7.45 | 2.56 | 55.5025 | 19.072 | 0.073725 | 0.005435 |
| ∑ | | | 123.1886 | 41.1115 | | 0.016436 |
By formula (19) we determine:
![]() .
.
To determine the root-mean-square error, we use formula (20)
0.005775kg-1 · m -2 .
By formula (18) we have

SJ = (2.996 0.005775)/0.3337 = 0.05185 kg m 2.
Given the reliability P = 0.95 , according to the table of Student coefficients for n = 5, we find t = 2.78 and determine the absolute error ΔJ = 2.78 0.05185 = 0.1441 ≈ 0.2 kg m 2.
We write the results in the form:
J = (3.0 ± 0.2) kg m 2;
Example 2 We calculate the temperature coefficient of resistance of the metal using the least squares method. Resistance depends on temperature according to a linear law
R t \u003d R 0 (1 + α t °) \u003d R 0 + R 0 α t °.
The free term determines the resistance R 0 at a temperature of 0 ° C, and the angular coefficient is the product of the temperature coefficient α and the resistance R 0 .
The results of measurements and calculations are given in the table ( see table 6).
Table 6
| n | t°, s | r, Ohm | t-¯t | (t-¯t) 2 | (t-¯t)r | r-bt-a | (r - bt - a) 2,10 -6 |
| 1 | 23 | 1.242 | -62.8333 | 3948.028 | -78.039 | 0.007673 | 58.8722 |
| 2 | 59 | 1.326 | -26.8333 | 720.0278 | -35.581 | -0.00353 | 12.4959 |
| 3 | 84 | 1.386 | -1.83333 | 3.361111 | -2.541 | -0.00965 | 93.1506 |
| 4 | 96 | 1.417 | 10.16667 | 103.3611 | 14.40617 | -0.01039 | 107.898 |
| 5 | 120 | 1.512 | 34.16667 | 1167.361 | 51.66 | 0.021141 | 446.932 |
| 6 | 133 | 1.520 | 47.16667 | 2224.694 | 71.69333 | -0.00524 | 27.4556 |
| ∑ | 515 | 8.403 | | 8166.833 | 21.5985 | | 746.804 |
| ∑/n | 85.83333 | 1.4005 | | | | | |
By formulas (21), (22) we determine
R 0 = ¯ R- α R 0 ¯ t = 1.4005 - 0.002645 85.83333 = 1.1735 Ohm.
Let us find an error in the definition of α. Since , then by formula (18) we have:
 .
.
Using formulas (23), (24) we have

 ;
;
0.014126 Ohm.
Given the reliability P = 0.95, according to the table of Student's coefficients for n = 6, we find t = 2.57 and determine the absolute error Δα = 2.57 0.000132 = 0.000338 deg -1.
α = (23 ± 4) 10 -4 hail-1 at P = 0.95.
Example 3 It is required to determine the radius of curvature of the lens from Newton's rings. The radii of Newton's rings r m were measured and the numbers of these rings m were determined. The radii of Newton's rings are related to the radius of curvature of the lens R and the ring number by the equation
r 2 m = mλR - 2d 0 R,
where d 0 the thickness of the gap between the lens and the plane-parallel plate (or lens deformation),
λ is the wavelength of the incident light.
λ = (600 ± 6) nm;
r 2 m = y;
m = x;
λR = b;
-2d 0 R = a,
then the equation will take the form y = a + bx.
.The results of measurements and calculations are entered in table 7.
Table 7
| n | x = m | y \u003d r 2, 10 -2 mm 2 | m-¯m | (m-¯m) 2 | (m-¯m)y | y-bx-a, 10-4 | (y - bx - a) 2, 10 -6 |
| 1 | 1 | 6.101 | -2.5 | 6.25 | -0.152525 | 12.01 | 1.44229 |
| 2 | 2 | 11.834 | -1.5 | 2.25 | -0.17751 | -9.6 | 0.930766 |
| 3 | 3 | 17.808 | -0.5 | 0.25 | -0.08904 | -7.2 | 0.519086 |
| 4 | 4 | 23.814 | 0.5 | 0.25 | 0.11907 | -1.6 | 0.0243955 |
| 5 | 5 | 29.812 | 1.5 | 2.25 | 0.44718 | 3.28 | 0.107646 |
| 6 | 6 | 35.760 | 2.5 | 6.25 | 0.894 | 3.12 | 0.0975819 |
| ∑ | 21 | 125.129 | | 17.5 | 1.041175 | | 3.12176 |
| ∑/n | 3.5 | 20.8548333 | | | | | |
Choosing the type of regression function, i.e. the type of the considered model of the dependence of Y on X (or X on Y), for example, a linear model y x = a + bx, it is necessary to determine the specific values of the coefficients of the model.
For different values of a and b, it is possible to construct an infinite number of dependencies of the form y x =a+bx, i.e., there are an infinite number of lines on the coordinate plane, but we need such a dependence that corresponds to the observed values in the best way. Thus, the problem is reduced to the selection of the best coefficients.
We are looking for a linear function a + bx, based only on a certain number of available observations. To find the function with the best fit to the observed values, we use the least squares method.
Denote: Y i - the value calculated by the equation Y i =a+bx i . y i - measured value, ε i =y i -Y i - difference between the measured and calculated values, ε i =y i -a-bx i .
The method of least squares requires that ε i , the difference between the measured y i and the values of Y i calculated from the equation, be minimal. Therefore, we find the coefficients a and b so that the sum of the squared deviations of the observed values from the values on the straight regression line is the smallest:
Investigating this function of arguments a and with the help of derivatives to an extremum, we can prove that the function takes on a minimum value if the coefficients a and b are solutions of the system:
 (2)
(2)
If we divide both sides of the normal equations by n, we get:

Given that  (3)
(3)
Get  , from here, substituting the value of a in the first equation, we get:

In this case, b is called the regression coefficient; a is called the free member of the regression equation and is calculated by the formula:
The resulting straight line is an estimate for the theoretical regression line. We have:
So, ![]() is a linear regression equation.
is a linear regression equation.
Regression can be direct (b>0) and inverse (b Example 1. The results of measuring the X and Y values are given in the table:
| x i | -2 | 0 | 1 | 2 | 4 |
| y i | 0.5 | 1 | 1.5 | 2 | 3 |
Assuming that there is a linear relationship between X and Y y=a+bx, determine the coefficients a and b using the least squares method.
Solution. Here n=5
x i =-2+0+1+2+4=5;
x i 2 =4+0+1+4+16=25
x i y i =-2 0.5+0 1+1 1.5+2 2+4 3=16.5
y i =0.5+1+1.5+2+3=8
and normal system (2) has the form ![]()
Solving this system, we get: b=0.425, a=1.175. Therefore y=1.175+0.425x.
Example 2. There is a sample of 10 observations of economic indicators (X) and (Y).
| x i | 180 | 172 | 173 | 169 | 175 | 170 | 179 | 170 | 167 | 174 |
| y i | 186 | 180 | 176 | 171 | 182 | 166 | 182 | 172 | 169 | 177 |
It is required to find a sample regression equation Y on X. Construct a sample regression line Y on X.
Solution. 1. Let's sort the data by values x i and y i . We get a new table:
| x i | 167 | 169 | 170 | 170 | 172 | 173 | 174 | 175 | 179 | 180 |
| y i | 169 | 171 | 166 | 172 | 180 | 176 | 177 | 182 | 182 | 186 |
To simplify the calculations, we will compile a calculation table in which we will enter the necessary numerical values.
| x i | y i | x i 2 | x i y i |
| 167 | 169 | 27889 | 28223 |
| 169 | 171 | 28561 | 28899 |
| 170 | 166 | 28900 | 28220 |
| 170 | 172 | 28900 | 29240 |
| 172 | 180 | 29584 | 30960 |
| 173 | 176 | 29929 | 30448 |
| 174 | 177 | 30276 | 30798 |
| 175 | 182 | 30625 | 31850 |
| 179 | 182 | 32041 | 32578 |
| 180 | 186 | 32400 | 33480 |
| ∑x i =1729 | ∑y i =1761 | ∑x i 2 299105 | ∑x i y i =304696 |
| x=172.9 | y=176.1 | x i 2 =29910.5 | xy=30469.6 |
According to formula (4), we calculate the regression coefficient
and by formula (5)
Thus, the sample regression equation looks like y=-59.34+1.3804x.
Let's plot the points (x i ; y i) on the coordinate plane and mark the regression line.

Fig 4
Figure 4 shows how the observed values are located relative to the regression line. To numerically estimate the deviations of y i from Y i , where y i are observed values, and Y i are values determined by regression, we will make a table:
| x i | y i | Y i | Y i -y i |
| 167 | 169 | 168.055 | -0.945 |
| 169 | 171 | 170.778 | -0.222 |
| 170 | 166 | 172.140 | 6.140 |
| 170 | 172 | 172.140 | 0.140 |
| 172 | 180 | 174.863 | -5.137 |
| 173 | 176 | 176.225 | 0.225 |
| 174 | 177 | 177.587 | 0.587 |
| 175 | 182 | 178.949 | -3.051 |
| 179 | 182 | 184.395 | 2.395 |
| 180 | 186 | 185.757 | -0.243 |
Y i values are calculated according to the regression equation.
The noticeable deviation of some observed values from the regression line is explained by the small number of observations. When studying the degree of linear dependence of Y on X, the number of observations is taken into account. The strength of the dependence is determined by the value of the correlation coefficient.
The problem is to find the linear dependence coefficients for which the function of two variables A And b takes the smallest value. That is, given the data A And b the sum of the squared deviations of the experimental data from the found straight line will be the smallest. This is the whole point of the least squares method.
Thus, the solution of the example is reduced to finding the extremum of a function of two variables.
Derivation of formulas for finding coefficients. A system of two equations with two unknowns is compiled and solved. Finding partial derivatives of functions ![]() by variables A And b, we equate these derivatives to zero.
by variables A And b, we equate these derivatives to zero.

We solve the resulting system of equations by any method (for example, the substitution method or the Cramer method) and obtain formulas for finding the coefficients using the least squares method (LSM). 
With data A And b function ![]() takes the smallest value.
takes the smallest value.
That's the whole method of least squares. Formula for finding the parameter a contains the sums , , , and the parameter n- amount of experimental data. The values of these sums are recommended to be calculated separately. Coefficient b found after calculation a.
The main area of application of such polynomials is the processing of experimental data (the construction of empirical formulas). The fact is that the interpolation polynomial constructed from the values of the function obtained with the help of the experiment will be strongly influenced by "experimental noise", moreover, during interpolation, the interpolation nodes cannot be repeated, i.e. you can not use the results of repeated experiments under the same conditions. The root-mean-square polynomial smoothes the noise and makes it possible to use the results of multiple experiments.
Numerical integration and differentiation. Example.
Numerical Integration- calculation of the value of a definite integral (as a rule, approximate). Numerical integration is understood as a set of numerical methods for finding the value of a certain integral.
Numerical differentiation– a set of methods for calculating the value of the derivative of a discretely given function.
Integration
Formulation of the problem. Mathematical statement of the problem: it is necessary to find the value of a certain integral
where a, b are finite, f(x) is continuous on [а, b].
When solving practical problems, it often happens that the integral is inconvenient or impossible to take analytically: it may not be expressed in elementary functions, the integrand can be given in the form of a table, etc. In such cases, numerical integration methods are used. Numerical integration methods use the replacement of the area of a curvilinear trapezoid by a finite sum of areas of simpler geometric shapes that can be calculated exactly. In this sense one speaks of the use of quadrature formulas.
Most methods use the representation of the integral as a finite sum (quadrature formula):
The quadrature formulas are based on the idea of replacing the graph of the integrand on the integration interval with functions of a simpler form, which can be easily integrated analytically and, thus, easily calculated. The simplest task of constructing quadrature formulas is realized for polynomial mathematical models.
Three groups of methods can be distinguished:
1. Method with division of the segment of integration into equal intervals. The division into intervals is done in advance, usually the intervals are chosen equal (to make it easier to calculate the function at the ends of the intervals). Calculate areas and sum them up (methods of rectangles, trapezoid, Simpson).
2. Methods with partitioning of the segment of integration using special points (Gauss method).
3. Calculation of integrals using random numbers (Monte Carlo method).
Rectangle method. Let the function (drawing) be integrated numerically on the segment . We divide the segment into N equal intervals. The area of each of the N curvilinear trapezoids can be replaced by the area of a rectangle.

The width of all rectangles is the same and equal to:
![]()
As a choice of the height of the rectangles, you can choose the value of the function on the left border. In this case, the height of the first rectangle will be f(a), the second one will be f(x 1),…, N-f(N-1).
If we take the value of the function on the right border as the choice of the height of the rectangle, then in this case the height of the first rectangle will be f (x 1), the second - f (x 2), ..., N - f (x N).
As can be seen, in this case one of the formulas gives an approximation to the integral with an excess, and the second with a deficiency. There is another way - to use the value of the function in the middle of the integration segment for approximation:
Estimation of the absolute error of the method of rectangles (middle)
Estimation of the absolute error of the methods of left and right rectangles.
Example. Calculate for the entire interval and dividing the interval into four sections
Solution. Analytical calculation of this integral gives I=arctg(1)–arctg(0)=0.7853981634. In our case:
1) h = 1; xo = 0; x1 = 1;
2) h = 0.25 (1/4); x0 = 0; x1 = 0.25; x2 = 0.5; x3 = 0.75; x4 = 1;
We calculate by the method of left rectangles:
![]()
We calculate by the method of right rectangles:
![]()
Calculate by the method of average rectangles:
![]()

Trapezoidal method. Using a polynomial of the first degree for interpolation (a straight line drawn through two points) leads to the trapezoid formula. The ends of the integration segment are taken as interpolation nodes. Thus, the curvilinear trapezoid is replaced by an ordinary trapezoid, the area of \u200b\u200bwhich can be found as the product of half the sum of the bases and the height

![]() In the case of N segments of integration for all nodes, except for the extreme points of the segment, the value of the function will be included in the total sum twice (since neighboring trapezoids have one common side)
In the case of N segments of integration for all nodes, except for the extreme points of the segment, the value of the function will be included in the total sum twice (since neighboring trapezoids have one common side)
![]()
The trapezoid formula can be obtained by taking half the sum of the rectangle formulas along the right and left edges of the segment:
Checking the stability of the solution. As a rule, the shorter the length of each interval, i.e. the greater the number of these intervals, the less the difference between the approximate and exact values of the integral. This is true for most functions. In the trapezoid method, the error in calculating the integral ϭ is approximately proportional to the square of the integration step (ϭ ~ h 2). Thus, to calculate the integral of a certain function in the limits a, b, it is necessary to divide the segment into N 0 intervals and find the sum of the areas of the trapezoid. Then you need to increase the number of intervals N 1, again calculate the sum of the trapezoid and compare the resulting value with the previous result. This should be repeated until (N i) until the specified accuracy of the result (convergence criterion) is reached.
For the rectangle and trapezoid methods, usually at each iteration step, the number of intervals increases by a factor of 2 (N i +1 =2N i).
Convergence criterion:
The main advantage of the trapezoid rule is its simplicity. However, if the integration requires high precision, this method may require too many iterations.
Absolute error of the trapezoidal method rated as
.
Example. Calculate an approximately definite integral using the trapezoid formula.
a) Dividing the integration segment into 3 parts.
b) Dividing the segment of integration into 5 parts.
Solution:
a) By condition, the integration segment must be divided into 3 parts, that is.
Calculate the length of each segment of the partition: ![]() .
.
Thus, the general formula of trapezoids is reduced to a pleasant size:

Finally:
I remind you that the resulting value is an approximate value of the area.
b) We divide the integration segment into 5 equal parts, that is, . by increasing the number of segments, we increase the accuracy of calculations.
If , then the trapezoid formula takes the following form:
Let's find the partitioning step: ![]() , that is, the length of each intermediate segment is 0.6.
, that is, the length of each intermediate segment is 0.6.
When finishing the task, it is convenient to draw up all calculations with a calculation table:
In the first line we write "counter"
As a result: 
Well, there really is a clarification, and a serious one!
If for 3 segments of the partition , then for 5 segments . If you take even more segment => will be even more accurate.
Simpson formula. The trapezoid formula gives a result that strongly depends on the step size h, which affects the accuracy of calculating a definite integral, especially in cases where the function is nonmonotonic. One can assume an increase in the accuracy of calculations if, instead of segments of straight lines replacing the curvilinear fragments of the graph of the function f(x), we use, for example, fragments of parabolas given through three neighboring points of the graph. A similar geometric interpretation underlies Simpson's method for calculating the definite integral. The entire integration interval a,b is divided into N segments, the length of the segment will also be equal to h=(b-a)/N.

Simpson's formula is:
![]() remainder term
remainder term
With an increase in the length of the segments, the accuracy of the formula decreases, therefore, to increase the accuracy, the composite Simpson formula is used. The entire integration interval is divided into an even number of identical segments N, the length of the segment will also be equal to h=(b-a)/N. The composite Simpson formula is:
In the formula, the expressions in brackets are the sums of the values of the integrand, respectively, at the ends of the odd and even internal segments.
The remainder term of Simpson's formula is already proportional to the fourth power of the step:
![]()
Example: Calculate the integral using Simpson's rule. (Exact solution - 0.2)


Gauss method
 Quadrature formula of Gauss. The basic principle of quadrature formulas of the second variety is visible from Figure 1.12: it is necessary to place the points in such a way X 0 and X 1 inside the segment [ a;b] so that the areas of the "triangles" in total are equal to the areas of the "segment". When using the Gauss formula, the initial segment [ a;b] is reduced to the interval [-1;1] by changing the variable X on
0.5∙(b– a)∙t+ 0.5∙(b + a).
Then ![]() , Where
, Where ![]() .
.
This substitution is possible if a And b are finite, and the function f(x) is continuous on [ a;b]. Gauss formula for n points x i, i=0,1,..,n-1 inside the segment [ a;b]:
 , (1.27)
Where t i And Ai for various n are given in reference books. For example, when n=2 ![]() A 0 =A 1=1; at n=3: t 0 =t 2" 0.775, t 1 =0, A 0 =A 2" 0.555, A 1" 0.889.
A 0 =A 1=1; at n=3: t 0 =t 2" 0.775, t 1 =0, A 0 =A 2" 0.555, A 1" 0.889.
Quadrature formula of Gauss
 obtained with a weight function equal to one p(x)= 1 and nodes x i, which are the roots of the Legendre polynomials
![]()
Odds Ai easily calculated by formulas
![]() i=0,1,2,...n.
i=0,1,2,...n.
The values of nodes and coefficients for n=2,3,4,5 are given in the table
| Order | Knots | Odds |
| n=2 | x 1=0 x 0 =-x2=0.7745966692 | A 1=8/9 A 0 = A 2=5/9 |
| n=3 | x 2 =-x 1=0.3399810436 x 3 =-x0=0.8611363116 | A 1 =A 2=0.6521451549 A 0 = A 3=0.6521451549 |
| n=4 | x 2 = 0 x 3 = -x 1 = 0.5384693101 x 4 =-x 0 =0.9061798459 | A 0 =0.568888899 A 3 =A 1 =0.4786286705 A 0 =A 4 =0.2869268851 |
| n=5 | x 5 = -x 0 =0.9324695142 x 4 = -x 1 =0.6612093865 x 3 = -x 2 =0.2386191861 | A 5 =A 0 =0.1713244924 A 4 =A 1 =0.3607615730 A 3 =A 2 =0.4679139346 |
Example. Calculate the value using the Gauss formula for n=2:
Exact value: ![]() .
.
The algorithm for calculating the integral according to the Gauss formula provides not for doubling the number of microsegments, but for increasing the number of ordinates by 1 and comparing the obtained values of the integral. The advantage of the Gauss formula is high accuracy with a relatively small number of ordinates. Disadvantages: inconvenient for manual calculations; must be stored in computer memory t i, Ai for various n.
The error of the Gauss quadrature formula on the segment will be at the same time For the formula of the remainder term will be where the coefficient α N decreases rapidly with growth N. Here ![]()
Gauss formulas provide high accuracy already with a small number of nodes (from 4 to 10). In this case, in practical calculations, the number of nodes ranges from several hundred to several thousand. We also note that the weights of Gaussian quadratures are always positive, which ensures the stability of the algorithm for calculating the sums