Do-it-yourself anemometer connection diagram. Homemade anemometer for measuring wind speed. PC software
Anemometer is a device for measuring wind speed. The classic cup anemometer is a purely mechanical instrument capable of measuring wind speeds in the range of 2 to 20 m/s. The anemometer simply counts the number of revolutions of the impeller. To determine the wind speed, it is necessary to measure the number of revolutions for a certain period of time, for example, 30 s, and then calculate the number of divisions that the anemometer needle passes in 1 s. After that, to determine the wind speed, you should use the graph.

It is easiest to design its analogue based on a low-power electric motor, for example, DM-03-3AM 3 91, which acts as a generator. The four-bladed anemometer impeller was taken ready-made, purchased on Aliexpress for about $ 1.

The impeller diameter is 10 cm and the height is 6 cm.

The electric motor is located in a housing made of a cold welding tank, in the lid of which a hole is cut for the electric motor shaft and wires leading from the engine.

A diode bridge VD1 assembled on Schottky diodes 1N5817 is connected to the electric motor. An electrolytic capacitor C1 1000 uF x 16 V is connected at the output of the diode bridge.
Anemometer connection diagram

Schottky diodes are chosen due to the fact that the speed of rotation of the impeller, under normal conditions (if there is no hurricane) is not very high. At a wind speed of about 6 m / s, a voltage of about 0.5 V appears at the output of the device. Under such conditions, it is rational to minimize losses on all circuit elements. For the same reason, conductors of an excessively large cross section are used as connecting wires.

Any 2 V DC voltmeter can be connected to the rectifier terminals. A multimeter does an excellent job with its role. Although the use of a separate pointer device allows you to directly calibrate the scale in wind speed.

Since the device was planned to be operated on the street, the diode bridge was filled in epoxy resin. As it turned out, the capacitor was taken too capacious so that the device cannot detect rapid voltage drops and, accordingly, gusts of wind. Reviewed by Denev.
DIY wind speed meter
There was a task to assemble an anemometer for one project so that it was possible to take data on a computer via a USB interface. The article will focus more on the anemometer itself than on the data processing system from it:
1. Components
So, for the manufacture of the product, the following components were needed:
Mitsumi ball mouse - 1 pc.
Ping-pong ball - 2 pcs.
A piece of plexiglass of the right size
Copper wire with a cross section of 2.5 mm2 - 3 cm
Ballpoint pen - 1 pc.
Chupa Chups candy stick - 1 pc.
Cable clip - 1 pc.
Hollow brass barrel 1 pc.
2. Making the impeller

3 pieces of copper wire 1 cm long each at an angle of 120 degrees were soldered to a brass barrel. In the hole of the barrel, I soldered a stand from a Chinese player with a thread at the end.
I cut the tube from the candy into 3 parts about 2 cm long.
I cut 2 balls in half and, using small screws from the same player and polystyrene glue (with a glue gun), attached the halves of the ball to the lollipop tubes.
I put the tubes with the halves of the ball on the soldered pieces of wire, and fixed everything on top with glue.
3. Manufacture of the main part


The bearing element of the anemometer is a metal rod from a ballpoint pen. In the lower part of the rod (where the cork was inserted), I inserted the disk from the mouse (encoder). In the design of the mouse itself, the lower part of the encoder rested against the body of the mouse, forming a point bearing, there was grease, so the encoder turned easily. But it was necessary to fix the upper part of the rod, for this I picked up a suitable piece of plastic with a hole exactly the diameter of the rod (such a piece was cut from the CD-ROMa carriage extension system). It remained to solve the problem so that the encoder rod did not fall out of the point bearing, so I soldered a few drops of solder on the rod directly in front of the retaining element. Thus, the rod rotated freely in the retaining structure, but did not fall out of the bearing.
The reason why the encoder circuit was chosen is the following: all the articles on homemade anemometers on the Internet described their manufacture based on a DC motor from a player, CD-ROM or some other product. The problem with such devices is, firstly, their calibration and low accuracy at low wind speeds, and secondly, the non-linear characteristic of the wind speed with respect to the output voltage, i.e. to transfer information to a computer, there are certain problems, you need to calculate the law of voltage or current change from wind speed. When using an encoder, there is no such problem, since the dependence is linear. The accuracy is the highest, since the encoder gives about 50 pulses per revolution of the anemometer axis, but the converter circuit is somewhat more complicated, in which there is a microcontroller that counts the number of pulses per second on one of the ports and outputs this value to the USB port.
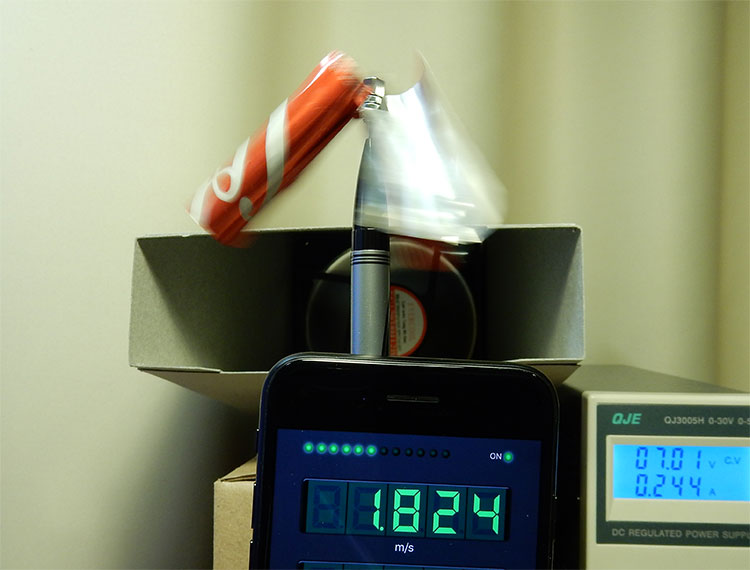
4. Testing and calibration
A laboratory anemometer was used for calibration.
By making a very simple device with your own hands and using this application, you will get a real anemometer for measuring wind speed or air flow in ventilation system. You can choose an anemometer design that best suits your requirements.
The determination of wind speed is based on measuring the rotational speed of a magnet with the phone's magnetometer. For each design of the anemometer, the dependence of the rotation speed on the air flow velocity is determined. These dependencies can be edited.
You can improve the proposed designs or make your own and calibrate it.
To select units (m/s, km/h, ft/s, mph, knots, Bft, Hz (revolutions per second), RPM (revolutions per minute)) or average value ("Avg1" is the last value, "Avg3 " and "Avg7" - average value) press the seven-segment display.
Don't neglect your phone case.
"Outdoor" anemometer


If you need to measure the wind speed on outdoors, then this type is best suited for this. The changes are not affected by the direction of the wind (vane anemometer) and the impeller will not be blown away by a strong gust of wind ("Sensitive" anemometer).
Specifications:
Measuring range from 0.5 m/s to 15 m/s.
Accuracy 0.5 m/s.

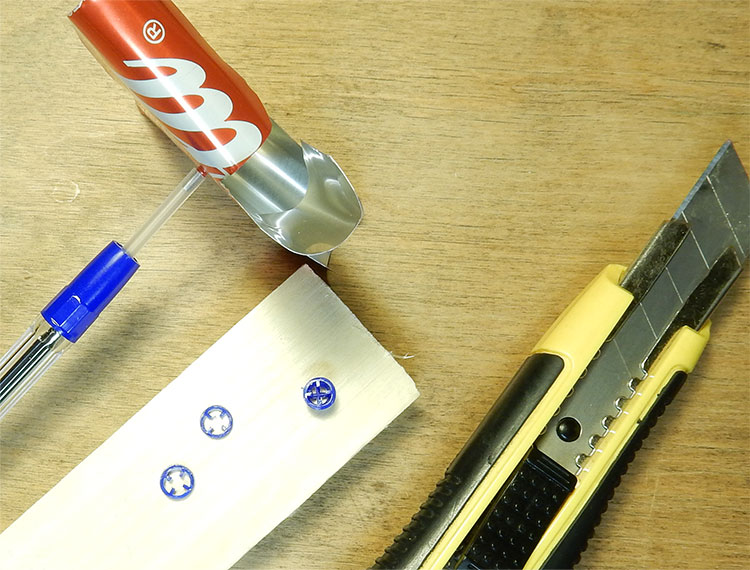
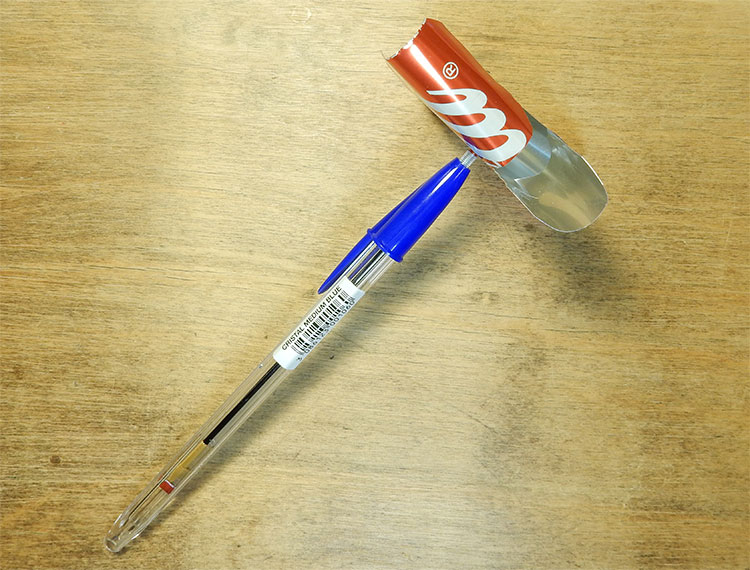
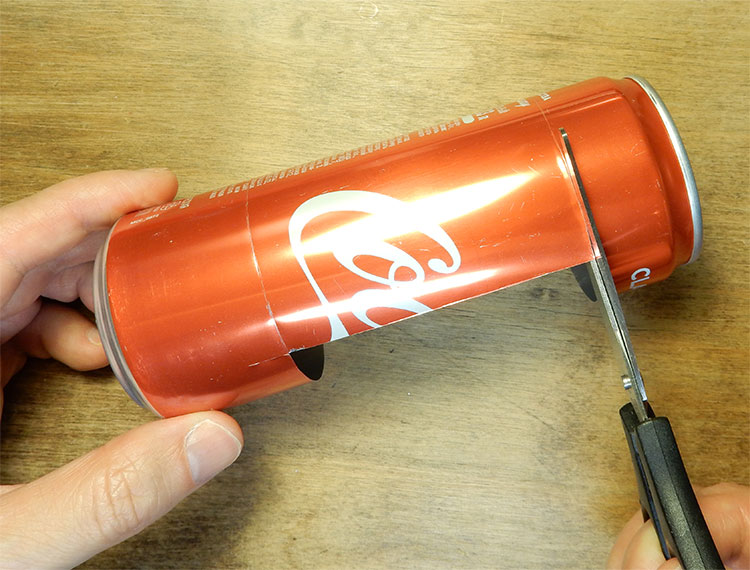
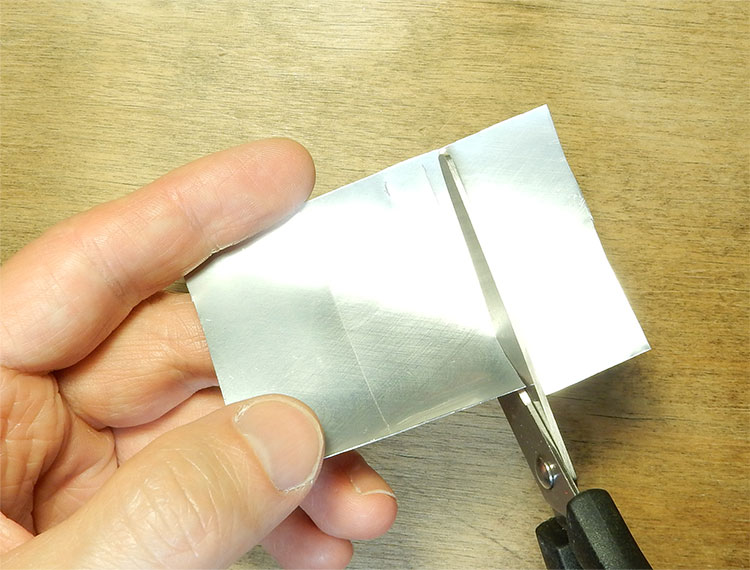
To make an anemometer, you need to cut a 3x3 inch (7.6x7.6 cm) square from an aluminum can.


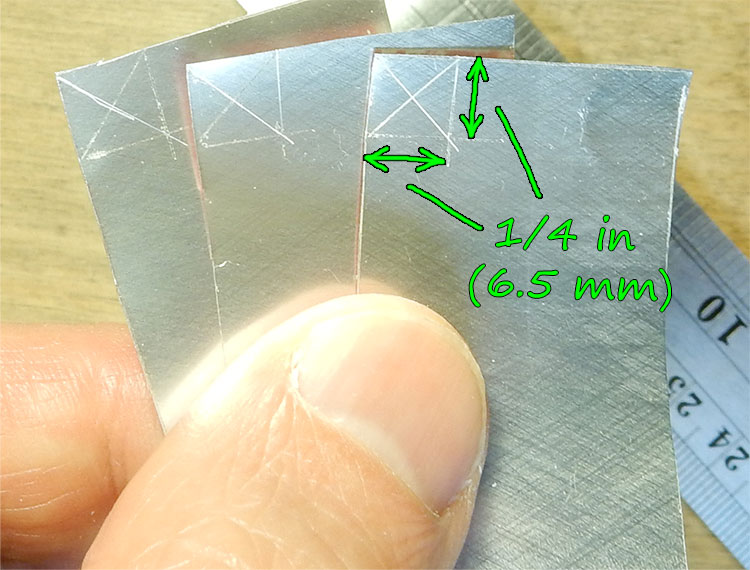
On the resulting sheet, you need to make markup.


Make cuts with scissors to the marks.


Attach very carefully desired shape. If the impeller does not immediately take the desired shape, then it can align after making a hole in the center.


All sharp corners must be cut off. This must be done so that the cut off corner does not get into someone's eye.


The impeller is screwed to the shaft of a ballpoint pen. The inner diameter of the rod can vary greatly. Therefore, it is difficult to write what size screw will fit. In the photo, a screw with a thread size of 2x6 mm is used. The head of the screw must be flat (counter-sunk) because the magnet must lie well on it. The slot of the Pozidriv screw (PZ) is preferred as such a slot is needed in another design of the anemometer.


Instead of a screw, you can use very small screws, nails, or even glue the impeller and magnet chewing gum(gum should be allowed to dry). If the carnation is a little less than necessary, then make notches on it.


Now you need to make a small cross from a 1/2 inch (1.2 cm) square with a small indentation in the center. You can use a smaller square, for example if the inner diameter of the handle is smaller.

The cross is carefully inserted into the handle and pushed all the way.

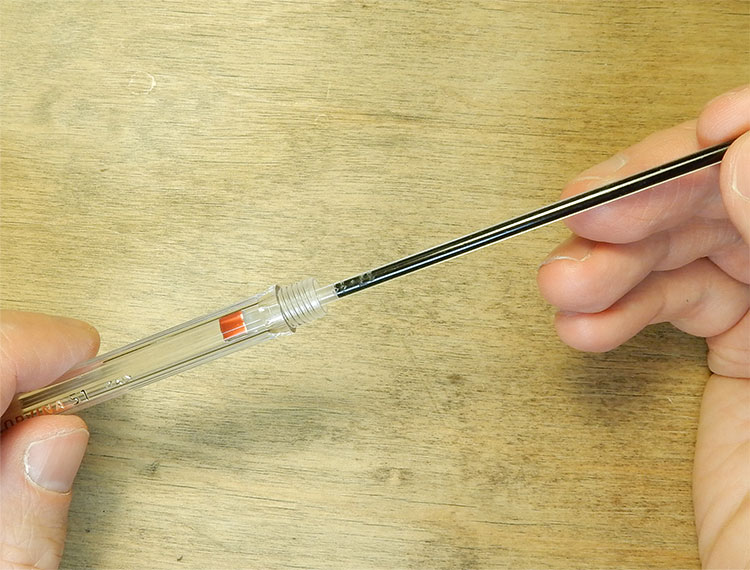

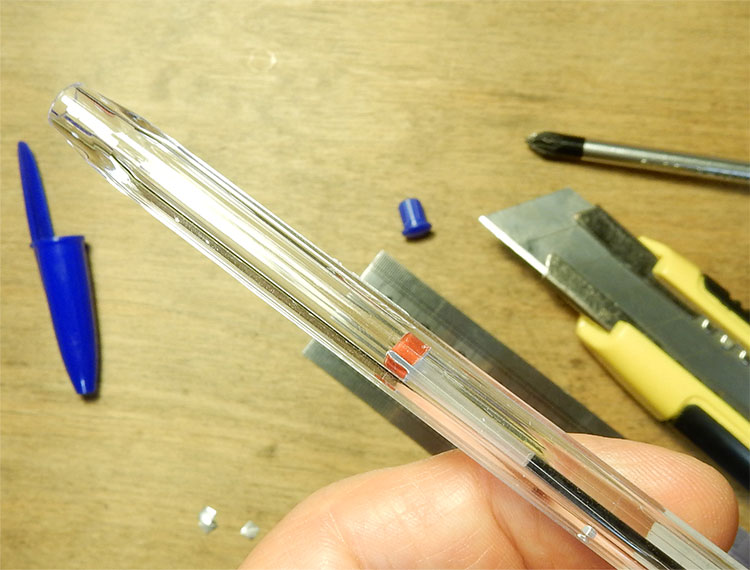
The anemometer is almost ready. It should spin easily when you blow on it. THE ROD SHOULD ONLY TOUCH THE CROSS WITH THE BALL (maybe for this you will have to make the cross a little smaller). TO SEE THIS, THE BALLPOINT PEN MUST BE TRANSPARENT.

Now you need to make sure that the rod does not hang out in the handle. To do this, cut off the top of the plug layer by layer, to the size of the hole when the rod is free to rotate.


It remains to attach the magnet and the anemometer is ready. used Neodymium magnet size 4x4x4 mm (the larger neodymium magnet does not center well on the screw head and will have to be glued). The poles of the magnet must be directed radially. Another magnet will help you find the poles of the cube. If you have a marker, be sure to label it with a magnet.


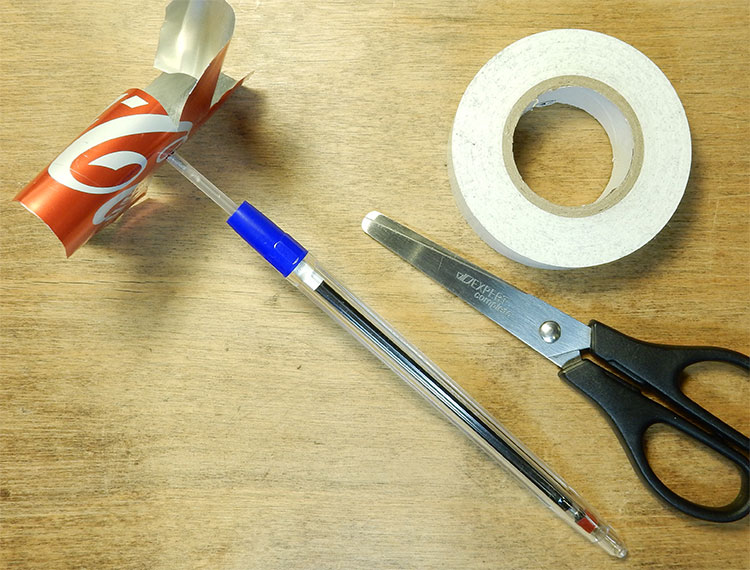
To prevent the impeller from flying out of the handle with a strong gust of wind, several layers of adhesive tape can be wound up to the diameter of the plug that does not pass into the hole. You can not wind too many layers so that there is no touching of the handle during rotation.

Other types of handles (eg "Bic Cristal") can be used to make an anemometer.
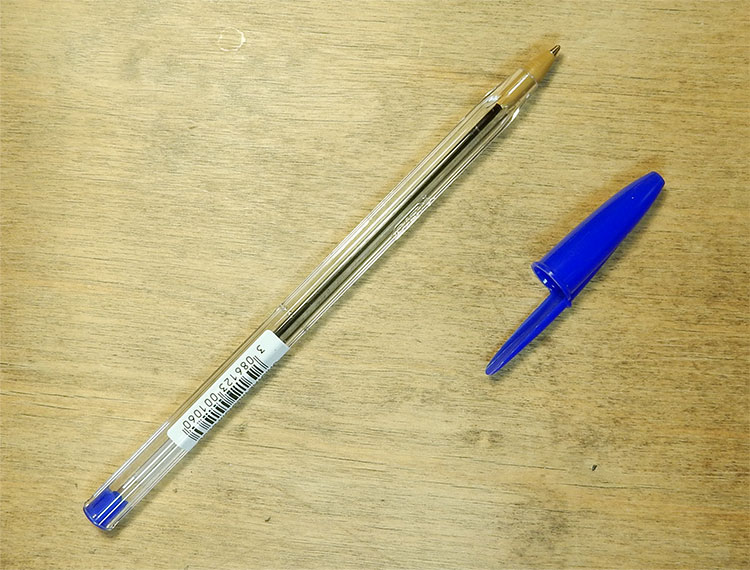
To remove the plug, place the blade of the knife as shown in the photo and push.

For this pen, you need to use a smaller cross made from a 3/8 inch (9 mm) square.


The size of the screw used is 2.5x6mm (#3) (or a 1.8mm barbed nail).
If you can't buy a small neodymium magnet, then whiteboard magnets can be used.


Flexible magnets are very weak and cannot be used.

Dependence of rotation frequency on wind speed:
2Hz - 1.5m/s
4Hz - 2.7m/s
6Hz - 3.8m/s
"Sensitive" anemometer

Specifications:
Measuring range from 0.5 m/s to 3.5 m/s.
Accuracy 0.5 m/s.
Update interval 2-5 sec.

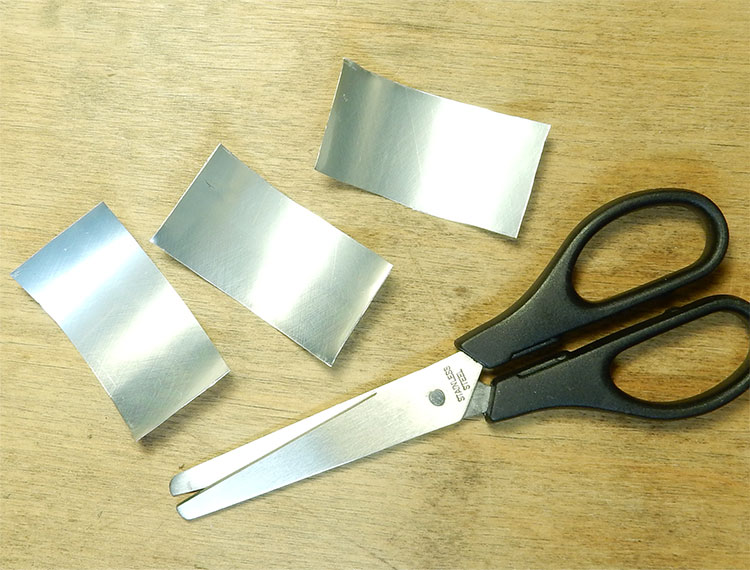
Cut out a 3x2 inch (7.6x5.1 cm) rectangle.


Mark out three rectangles 1 inch (2.53 cm) wide.


It is very important to use a Pozidriv (PZ) screw. Because in such a slot, the needle does not touch the side walls. The length of the screw should be as short as possible so that the magnet is as low as possible. The photo uses a 2x6mm screw.

After tightening the screw, the "wings" are carefully parted and the impellers are given the desired shape.


In order for the magnet to hold well on the screw, you need to fasten another nut. But don't twist it.
Due to the attachment of a neodymium magnet (4x4x4 mm), the center of gravity of the impeller rises and it becomes unstable on the needle. To lower the center of gravity, weights must be glued to the INSIDE of the "wings" (washers for a 4 mm screw are used).
The impeller can spin not only on an awl, but also on VERY WELL sharpened pencils or on a sewing needle attached to a pencil. On a sewing needle, the impeller spins best, but this option requires great care and is STRICTLY NOT SUITABLE FOR CHILDREN.

The dependence of the rotation frequency on the wind speed (on a mechanical pencil 0.5 mm):
1.5Hz - 1.4m/s
4Hz - 2.85m/s
6Hz - 3.4m/s
vane anemometer

Designed to measure the air flow rate in ventilation systems.
Specifications:
Measuring range from 1.75 m/s to 3.0 m/s.
Accuracy 0.2 m/s.
Update interval 2-5 sec.
This anemometer is made from a fan with rolling bearings. You can choose a fan of any size, but keep in mind that the smaller the size of the fan, the lower the sensitivity of the anemometer. It uses an 80x80x25mm fan.

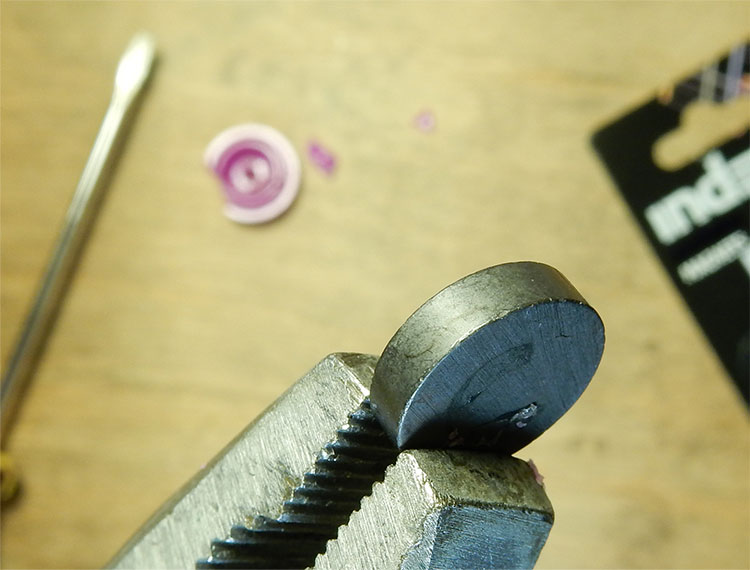
To make the fan rotate easily, you need to pull out the ring magnet from it.


When removing the retaining ring, it must be held by hand so that it does not fly away and is not lost.


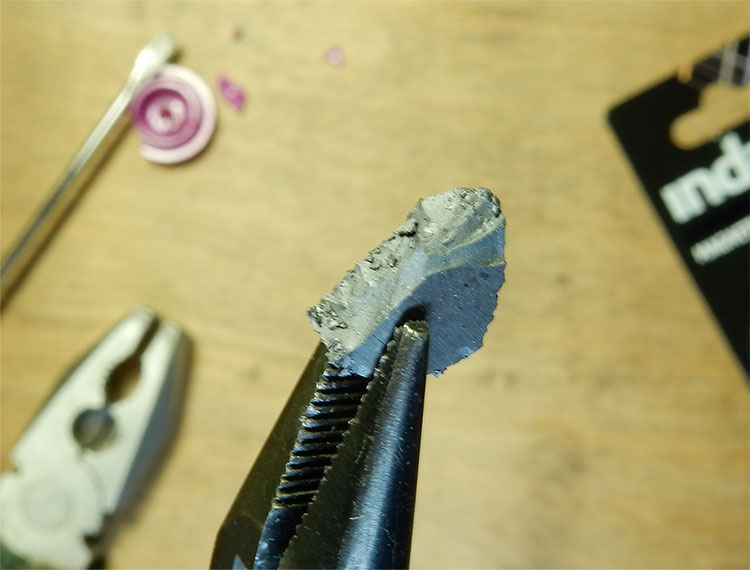
To pull out the ring magnet, you need to put a flathead screwdriver under it and turn the screwdriver a little. This should push the magnet out a little. By repeating this action, you need to EQUALLY lift the entire magnet.


When the magnet rises to a position where it can no longer be lifted with a screwdriver, a screw (4x30(>30) mm) must be used.


Now the fan is going. And if you do not put on the retaining ring, then the fan will be easier to spin, but the impeller may fall out.
The dependence of the rotational speed on the air flow rate:
4Hz - 1.85m/s
6Hz - 2.3m/s
8Hz - 2.55m/s
12Hz - 2.7m/s
18Hz - 2.8m/s
If something is not clear, be sure to write an email.
For the manufacture of a device that measures the speed of air flow, improvised means will be required. For example, halves of plastic Easter eggs can be used as anemometer blades. You will also need a compact permanent magnet brushless motor. The main thing is that the resistance of the bearings on the motor shaft is minimal. This requirement is due to the fact that the wind can be very weak, and then the motor shaft simply will not turn. To create an anemometer, an engine from an old hard drive will fit.
The main difficulty in assembling an anemometer is to make a balanced rotor. The engine will need to be installed on a massive base, and a thick plastic disk should be placed on its rotor. Then, three identical hemispheres must be carefully cut out of plastic eggs. They are fixed on the disk with studs or steel rods. In this case, the disk must first be divided into sectors of 120 degrees.
Balancing is recommended to be carried out in a room where there are no wind movements at all. The axis of the anemometer must be in a horizontal position. Weight adjustment is usually done with needle files. The point is that the rotor stops in any position, not in the same one.
Instrument calibration
A homemade device must be calibrated. The best way to calibrate is to use a car. But some kind of mast is needed so that it does not get into the zone of disturbed air created by the car. Otherwise, the readings will be highly distorted.
Calibration should only be carried out on a calm day. Then the process will not be delayed. If the wind blows, you will have to drive along the road for a long time and calculate the average values of the wind speed. Keep in mind that the speedometer is measured in km/h and the wind speed in m/s. The ratio between them is 3.6. This means that the speedometer readings will need to be divided by this number.
Some people use a voice recorder during the calibration process. You can simply dictate the readings of the speedometer and anemometer to an electronic device. In you can create a new scale for your homemade anemometer. Only with the help of a properly calibrated device can reliable data on the wind situation in the required area be obtained.
The weather station is built on a Picaxe microcontroller from Revolution Education Ltd and consists of two main parts: outdoor unit, which sends its data every 2 seconds, using a transmitter at 433MHz. And an indoor unit that displays the received data on a 20 x 4 LCD display, as well as atmospheric pressure, which is measured locally in the indoor unit.

I tried to keep the design as simple and functional as possible. The device communicates with the computer via the COM port. Currently, graphs are continuously built on the computer from the obtained values, and the values are also displayed on conventional indicators. Graphs and sensor readings are available on the built-in web server, all data is saved and so on. You can view data for any period of time.

The construction of the weather station took several months, from design to completion, and overall I am very pleased with the result. I'm especially glad that I was able to build everything from scratch with the usual tools. It completely suits me, but there is no limit to perfection, and this is especially true for the graphical interface. I have not made any attempt to commercialize the weather station, but if you are thinking of building a weather station for yourself, then this is a good choice.
Outdoor sensors
Sensors are used to measure temperature, humidity, precipitation, wind direction and speed. Sensors are a combination of mechanical and electronic devices.
Temperature and relative humidity sensor
Measuring temperature is perhaps the easiest. For this, the DS18B20 sensor is used. The HIH-3610 was used to measure humidity, outputting a voltage of 0.8 - 3.9V at a humidity of 0% to 100%

I installed both sensors on a small printed circuit board. The board is installed inside a homemade case that prevents rain and other external factors.

The simplified code for each of the sensors is shown below. More precise code that reads values to one decimal place is shown on Peter Anderson's site. Its code is used in the final version of the weather station.
The temperature sensor provides an accuracy of ± 0.5 °C. The humidity sensor provides accuracy up to ± 2%, so it doesn't really matter how many decimal places are available!
An example of a plot from a software running on a PC.
Temperature
Main: readtemp B.6, b1 ; read value into b1 if b1 > 127 then neg ; test for negative sertxd (#b1, cr, lf) ; transmit value to PE terminal pause 5000 goto main neg: b1 = b1 - 128 ; adjust neg value sertxt("-") ; transmit negative symbol sertxt (#b1, cr, lf) ; transmit value to PE terminal pause 5000 goto main
Humidity
Main: readadc B.7,b1 ; read humidity value b1 = b1 - 41 * 100 / 157 ; change to %RH sertxd (#b1, "%", cr, lf) pause 5000 ; wait 5 seconds goto main
Humidity Sensor Calculation
Calculations taken from Honeywell HIH-3610 sensor documentation. The graph shows the standard curve at 0 °C.

The voltage from the sensor is measured at the ADC input (B.7) of the Picaxe 18M2 microcontroller. In the code shown above, the value, which is represented as a number from 0 to 255 (i.e. 256 values), is stored in the b1 variable.
Our circuit is powered by 5V, so each ADC step is:
5/256 = 0.0195 V.
The graph shows the initial value of the ADC 0.8 V:
0.8 / 0.0195 = 41
Taking the values from the graph, the slope of the graph (taking into account the offset) is approximately:
Output voltage / % RH or
(2.65 - 0.8) / 60 = 0.0308 V in % RH
(In documentation 0.0306)
Let's calculate the number of ADC steps for 1% humidity:
(V per % RH) / (ADC step)
0.0308 / 0.0195 = 1.57
%RH = ADC value - ADC offset / (ADC steps in %RH), or
%RH = ADC value - 41 / 1.57
The final calculation formula for the microcontroller will look like: %RH = ADC value - 41 * 100/157
Protective case

Start by cutting each panel in two. The planks on one part will be firmly attached on both sides, and on the second part only on one side. Do not throw away these parts - they are used.

Attach two to whole parts wooden bars 20mm x 20mm top and bottom, and screw the other pieces to them.

Cut one of the pieces with one whole side to size and glue it to the inside of one of the sides. Make sure the planks are glued so that they form a "^" shape together. Do this for all sides.

Wind speed and direction meter
Mechanical
Wind speed and direction sensors are a combination of mechanical and electronic components. The mechanical part is identical for both sensors.

A 12mm plywood insert (marine ply) is placed between the PVC pipe and the stainless steel disc at the top end of the pipe. The bearing is glued to a stainless steel disc and held in place by a stainless steel plate.

Once everything is fully assembled and set up, the exposed areas are sealed with caulk for water tightness.

The other three holes in the photo are for the blades. Blades 80 mm long give a turning radius of 95 mm. Cups 50 mm in diameter. For these, I used cropped cologne bottles that are almost spherical in shape. I'm not sure about their reliability, so I made them easily replaceable.
Electronic part

The electronics for the wind speed sensor consists only of a transistor switch, a photodiode and two resistors. They are mounted on a small round PCB with a diameter of 32mm. They are installed freely in the pipe so that moisture, if it enters, flows down without touching the electronics.

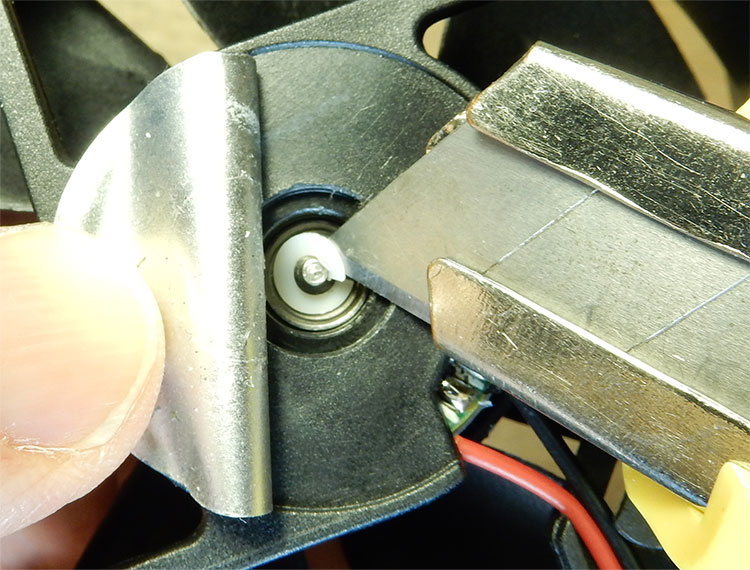
The anemometer is one of the three sensors that needs to be calibrated (the other two are the precipitation counter and the barometric pressure sensor)
The photodiode provides two pulses per revolution. In the simple "serial" system I was aiming for (all sensors are polled in turn), there must be a trade-off between the length of time spent polling each sensor (in this case, counting pulses) and the responsiveness of the system as a whole. Ideally, a full cycle of polling all sensors should take no more than 2-3 seconds.

In the photo above, checking the sensor using a motor with adjustable speed.
; LCD-specific commands shown in blue hsersetup B9600_4, %10000 ; Use LCD Pin 1, no hserin hserout 0, (13) : pause 100 ; Initialize LCD hserout 0, (13) : pause 100 hserout 0, (13) : pause 100 pause 500 hserout 0, ("ac1", 13) ; Clear display pause 50 hserout 0, ("acc", 13) hserout 0, ("ac81", 13, "adcount: ", 13) ; Print the headings pause 10 hserout 0, ("ac95", 13, "adpulsin: ", 13) ; Print the headings pause 10 do count C.2, 1000, w0 ; Count the pulses (two per rev) w1 = 0 for b8 = 1 to 2 ; Measure pulse length twice pulsin C.2, 1, w2 ; per rev and... w1 = w1 + w2 next w1 = w1 / 2 ; ...calculate average hserout 0, ("ac89", 13, "ad ", #w0, " ", 13) ;Print the count value hserout 0, ("ac9d", 13, "ad ", #w1, " ", 13) ;Print the pulse-length value pause 100 loop
I wanted to calibrate it while driving, but there was no time for that. I live in a relatively flat area with an airport a few miles away, so I calibrated the sensor by comparing my wind speed readings to the airport readings.
If we had 100% efficiency and the blades would spin at the speed of the wind, then:
Rotor Radius = 3.75"
Rotor Diameter = 7.5" = 0.625 ft
Rotor circumference = 1.9642 feet
1 ft/min = 0.0113636 m/h,
1.9642 ft/min = 1 rpm = 0.02232 m/h
1 m/h = 1 / 0.02232 rev
1 m/h = 44.8 rpm
? m/h = rev / 44.8
= (rpm * 60) / 44.8
Since there are two pulses per turn
? m/h = (pulses per second * 30) / 44.8
= (pulses per second) / 448
Wind direction sensor - mechanical part
In the wind direction sensor, a magnet is used instead of an aluminum plate, and a special AS5040 chip (magnetic encoder) is used instead of an optoelectronic unit.

The photo below shows a 5mm magnet mounted on the end of a central screw. The alignment of the magnet with the chip is very important. The magnet should be exactly centered about 1mm above the chip. Once everything is exactly aligned, the sensor will work properly.

Wind direction sensor - electronic part
There are various schemes for measuring wind direction. Basically they consist of either 8 reed switches spaced at 45 degrees at intervals of a rotating magnet or a potentiometer that can be fully rotated.
Both methods have their advantages and disadvantages. The main advantage is that they are both easy to implement. The disadvantage is that they are subject to wear - especially potentiometers. An alternative to using reed switches would be to use a Hall effect sensor to deal with mechanical wear, but they are still limited to 8 different positions... Ideally, I would try something different and ultimately decided on a rotary magnetic IC sensor. Although it is a surface mount device (which I try to avoid), it has a number of advantages that make it attractive to use!
It has several different output formats, two of which are the most suitable for our purpose. The best accuracy is achieved with the SSI interface. AS5040 delivers pulses from 1 µs at 0° to 1024 µs at 359.6°


Wind direction sensor calibration check:
Do readadc10 B.3, w0 ;Read from AS5040 magnetic bearing pause 100 w0 = w0 * 64 / 182 ; Convert to 0 - 360 (degrees) debug ; Display in Prog/Edit debug window loop

Precipitation meter

As far as possible, I made the rain gauge out of plastic and stainless steel, the base is made of 3 mm thick aluminum for rigidity.
There are two buckets in the rain gauge. Each pail holds up to 6 ml of water before it shifts its center of gravity, which causes it to pour water into the pail and signal a sensor. When the bucket is tipped over, the aluminum flag passes through an optical sensor that sends a signal to the outdoor unit's electronics.

For now, I've left it with transparent walls (because it's fun to watch it work!). But I suspect it needs to be painted white to reflect heat in the summer to avoid evaporation. I couldn't find a small funnel, so I had to make my own. Pay attention to the wire inside the funnel and in the center of the gutter. This will help stop the surface tension of the water in the funnel and help the water drip. Without the wire, the rain would tend to "swirl" and its trajectory would be unpredictable.

Optosensors close-up:

Electronic part of the rain gauge

Due to the random nature of the sensor, a software interrupt in the outdoor unit's MCU seemed to be the logical approach. Unfortunately, some program instructions disable the interrupt mechanism while they are being executed, thus. there is a chance that the signal will go nowhere. For these reasons, the rain gauge has its own 08M Picaxe microcontroller.
Using a separate chip allows it to be used to create a 1-hour delay accurate enough to count buckets per hour.
Calibration
Picaxe 18m2 receives the current number of buckets per hour and displays it on the display and computer.
As a starting point, I use the following data:
Funnel diameter 120mm and container area 11.311mm2
1 mm of rain = 11.311 mm3 or 11.3 ml.
Each bucket is 5.65 ml. Thus, 2 buckets 2 x 5.65 = 11.3 ml (or 1 mm) of precipitation. One bucket = 0.5 mm of precipitation.
For comparison, I bought a cheap rain gauge.

The above circuit and the 08M Picaxe circuit use the same PCB layout for the sensor. The device is powered by a 12V 7Ah battery through a 7805 stabilizer.
I used the RF Connect kit for 433 MHz wireless. The kit contains a pair of specially programmed PIC controllers. A set of wireless modules during the tests proved to be quite reliable.

08M Picaxe and 18m2 are installed on the PP. Each of them has its own programming connector. Separate connectors, each with their own +5V, are dedicated to each sensor - except for temperature and humidity.
Please note that I drew the drawing in Paintshop Pro so I cannot guarantee pin spacing accuracy.


indoor unit
The indoor unit uses 18m2 Picaxe, pressure sensor and LCD display. There is also a 5V voltage regulator.
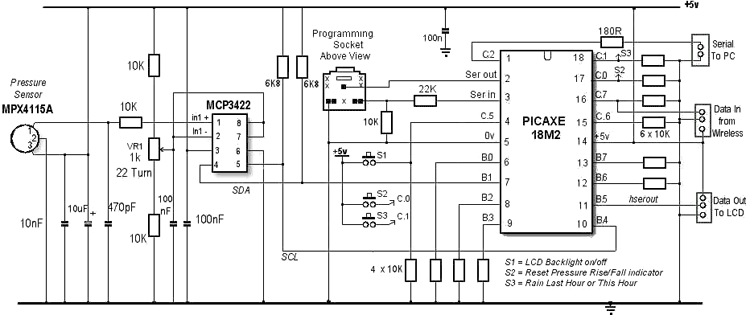
Pressure meter
After several unsuccessful attempts, I settled on the MPX4115A. Although other sensors have a slightly larger measuring range, they are difficult to access. In addition, other sensors usually operate on 3.3V and require an additional regulator. The MPX4115A provides an analog voltage of 3.79V to 4.25V proportional to pressure. Although this is almost sufficient resolution to detect 1 mbar of pressure change, after some discussion on the forum, I added an MCP3422 ADC. It can run in 16-bit mode (or higher) compared to Picaxe's 10-bit mode. The MCP3422 can be connected (as in our circuit) in differential mode with an analog input from a sensor. The main advantage is that this allows the sensor output to be corrected, thereby easily compensating for MPX4115A errors and providing an easy way to calibrate the sensor.
The MPC3422 actually has two differential inputs, but since one is not being used they are shorted. The output from the MCP3422 has an I2C interface and connects to the SDA and SCL pins on the 18m2 Picaxe - pins B.1 and B.4 respectively. From my point of view, the only drawback to using the MCP3422 is that it is a small surface mount device, but I soldered it to the adapter. In addition to the I2C interface, the MCP3422 18m2 simply processes the incoming data from the 433MHz wireless receiver, displays the data on the display, and transfers the data to the PC. In order to avoid indoor unit errors when the computer is not working, there is no response from the PC. indoor unit passes the data and moves on. It transmits data at approximately 2 second intervals so that data loss is quickly compensated for next time. I used the unused ports on 18m2 to connect the button on the front panel. Switch S1 (input C.5) is used to turn on the LCD backlight. Switch S2 (input C.0) resets the pressure value (mbar) on the LCD display. Switch S3 (input C.1) switches the precipitation displayed on the LCD display between the total of the previous hour and the current one. The buttons must be held down for more than 1 second for them to respond.

Assembling the indoor unit

As with the PCB for the outdoor unit, I drew the layout by hand using Paintshop Pro, so there may be errors in the distances.

The board is slightly larger than necessary to fit into the slots in the aluminum case.
I deliberately made the programming connector slightly "inward" from the edge of the board to prevent it from touching the case. The cutout for the LCD display is drilled and cut to exact dimensions.

The photo shows everything already installed in the case.
The pins on the board make it difficult to install it into the case, so I had to desolder them and solder the display to the board with wires.

Outdoor unit - Picaxe code
; ================================================= ================ ; Main 18M2 code for the Picaxe Weather Station Outdoor (Transmitter) Unit ; Decimal precision Humidity & Temperature routines, ; copyright, Peter H Anderson, Baltimore, MD, Jan, "04 ; ; ================================= ================================ #Picaxe 18M2 Symbol HValue = w0 Symbol HighWord = w1 Symbol LowWord = w2 Symbol RH10 = w3 Symbol HQuotient = b0 Symbol HFract = b1 Symbol X = b0 Symbol aDig = b1 Symbol TFactor = b2 Symbol Tc = b3 Symbol SignBit = b4 Symbol TValue = w4 Symbol TQuotient = b10 Symbol TFract = b11 Symbol TempC_100 = w6 Symbol MagDir = w7 Symbol MagDirLo = b14 Symbol MagDirHi = b15 Symbol WindSpeed = w8 Symbol WindSpeedLo = b16 Symbol WindSpeedHi = b17 Symbol ThisHour = b18 Symbol LastHour = b19 Symbol RainRequest = b20 Hardware Symbol HumidRaw = B.7 Symbol TempRaw = B.6 Symbol DirRaw = B. 3 Symbol Speed = B.0 do ;Read Humidity ReadADC10 HumidRaw, HValue ;Get Humidity (HValue) HighWord = 1613 ** HValue ;calculate RH LowWord = 1613 * HValue RH10 = LowWord / 1024 LowWord = Highword * 64 RH10 = RH10 + LowWord RH10 = RH10 - 258 pause 100 ;Read temperature Readtemp12 TempRaw, TValue ; Get temperature SignBit = TValue / 256 / 128 if SignBit = 0 then positive ; It"s negative so TValue = TValue ^ $ffff + 1 ; take twos comp positive: TempC_100 = TValue * 6 ; TC = value * 0.0625 TValue = TValue * 25 / 100 TempC_100 = TempC_100 + TValue TQuotient = TempC_100 / 100 TFract = TempC_100 % 100 / 10 X = TQuotient / 10 ; Calculate temperature correction factor for Humidity if SignBit = 0 then SignBit = " " else SignBit = "-" endif if SignBit = "-" then X = 4 - X else X = X + 4 endif GoSub TempCorrection ;compensate RH HQuotient = RH10 / 10 ;Calculate RH Quotient and... HFract = RH10 % 10 ;...decimal place.if HQuotient > 99 then ;Over range HQuotient = 99 HFract = 9 endif if HQuotient > 127 then ; Under range HQuotient = 0 HFract = 0 endif ; Read AS540 magnetic encoder for wind direction readadc10 DirRaw, MagDir ; Read from AS5040 magnetic bearing pause 100 ; Read rpm from windspeed counter count Speed, 1000, WindSpeed ; Every 30th cycle (approx 1 minute), request rain gauge data from 08M inc RainRequest if RainRequest >= 30 then high C.1 serin , C.0, N2400, ("r"), LastHour, ThisHour ; Rain counters low C.1 RainRequest = 0 endif ; Send data to Indoor Unit in 8 byte blocks ; First group needs no calibration so calculations are done here first. ; Second group will need "tweaking" - more easily done at indoor end. serout C.2, N2400, ("t", SignBit, TQuotient, TFract, HQuotient, HFract, "A", "B") pause 100 serout C.2, N2400, ("m", MagDirHi, MagDirLo, WindSpeedHi, WindSpeedLo, LastHour, ThisHour, "C") loop TempCorrection: Lookup X, (87, 89, 91, 93, 95, 97, 99, 101, 103, 106, 108, 110, 113, 116, 119, 122, 126 ), TFactor " -40 -30 -20 -10 0 10 20 30 40 50 60 70 80 90 100 110 120 if TFactor< 100 then aDig = TFactor / 10 RH10 = RH10 * aDig / 10 TFactor = TFactor % 10 aDig = TFactor RH10 = RH10 * aDig / 100 + RH10 else TFactor = TFactor % 100 aDig = TFactor / 10 RH10 = RH10 * aDig / 10 + RH10 TFactor = TFactor % 10 aDig = TFactor RH10 = RH10 * aDig / 100 + RH10 endif returnMemory used = 295 bytes out of 2048
Rainfall counter - 08M code
#picaxe 08M Symbol ThisHour = b2 ; Store the current sensor count in b2 Symbol LastHour = b3 ; Save the previous hour"s count in b3 ;Hardware definitions Symbol DataRequest = pin3 Symbol BucketSensor = pin4 setint %00010000, %00010000 ; pin4 is interrupt pin main: for w0 = 1 to 60000 ; Loop for 1 hour pause 60 next LastHour = ThisHour ; Update Last hour"s count with ThisHour = 0 ; current hour & reset current hour goto main ; Do the next hour interrupt: setint %00010000, %00010000 ; Re-instate interrupt if DataRequest = 1 then ; Was the interrupt from the 18M2 ? serout 2, N2400, ("r", LastHour, ThisHour) ; Yes, so send previous hour"s count & curent count. do: loop while DataRequest = 1 ; Wait until 18M2 stops requesting before continuing endif if BucketSensor = 1 then ; Was the interrupt from the rain sensor? inc ThisHour ; Yes, so increment bucket-tip count do: loop while BucketSensor = 1 ; Make sure flag has cleared sensor before continuing endif returnIndoor unit - Picaxe code
;================================================ =========================== ; Main Indoor (Receiver) Program. ; ; Receives data from outdoor unit, displays on LCD and passes data on to PC ; Also measures the barometric pressure (thanks to "motherp") ;==================================== ======================================= #PICAXE 18M2 ; Variable Definitions (b2 to b5 are re-used for mBar code when they become available) symbol Quotient = b2 symbol Fract = b3 symbol SignBit = b4 symbol Humidity = b5 symbol HFract = b14 symbol Dir = w5 symbol DirLo = b10 symbol DirHi = b11 symbol Speed = w3 symbol SpeedLo = b6 symbol SpeedHi = b7 symbol RainCountThisHour = b12 symbol RainCountLastHour = b13 symbol LCDRainWhole = b21 symbol LCDRainFract = b22 symbol LastOrThis = b23 ; MCP3422 ADC variables symbol mb900 = 17429 ; ADC reading for 900Mbar, then add 72.288 counts per mbar symbol adj0 = 72 symbol mBarADCValue = w0 symbol adj1 = b4 ; used to add 1 count every 4 mbar symbol adj2 = b5 ; used to add 1 count every 24 mbar symbol mBar = w4 ; Housekeeping variables symbol lastmbar = w8 ; Remember previous mBar reading symbol RiseFall = b18 ; Indicator for pressure rising or falling (up arrow or down arrow) symbol active = b19 ; Telltale shows activity on LCD screen symbol LCD_Status = b20 ; Is LCD Backlight on or off (0 or 1)? ; Hardware Definitions symbol Wireless = C.7 ; Incoming connection from Wireless receiver/decoder symbol Computer = C.2 ; Outgoing serial connection to computer symbol LCD = pinC.5 ; Front-panel button to blank / unblank LCD backlight symbol ClearRiseFall = pinC.0 ; Front-panel button to clear pressure "rising / falling" indicator symbol LastOrThisSwitch = pinC.1 ; Front-panel button to display current or previous hour"s rainfall Init: hsersetup B9600_4, %10000 ; Use LCD Pin 1, no hserin ; ByVac 20x4 IASI-2 Serial LCD hi2csetup i2cmaster, %11010000, i2cfast, i2cbyte ; Initialize I2C for MCP3422 ADC chip.hi2cout (%00011000) ;set MCP3422 for 16 bit continuous conversion pause 500 hserout 0, (13) : pause 100 ;Initialize LCD hserout 0, (13) : pause 100 hserout 0, (13) : pause 100 pause 500 hserout 0, ("ac50", 13) hserout 0, ("ad", 32, 32, 32, 32, 49, 42, 36, 32, 13) ; Define down arrow character (char 10) hserout 0, (" ac1", 13) ; Clear display pause 50 hserout 0, ("acc", 13) ; Hide cursor hserout 0, ("ac81", 13, "ad ", $df, "C", 13) ; Print the headings hserout 0, ("ac88", 13, "admBar", 13) hserout 0, ("ac8e", 13, "adRH %", 13) hserout 0, ("acd5", 13, "ad", "dir" , 13) ; Print footings hserout 0, ("acdc", 13, "ad", "mph", 13) ; hserout 0, ("ace3", 13, "ad", "mm", 13) lastmbar = 0 ; Initialize variables LastOrThis = "c" ;======================================= ================================= ; Main Loop ;============================================== =========================== main: ; Check if a front-panel switch is pressed. The Picaxe interrupt mechanism is ; almost permanently disabled due to the large number of serin and serout commands ; so sprinkling the program with "gosub switches" to check the switch status is more ; effective that interrupts. gosub switches ; Get first group of values from outdoor unit via 433MHz radio link. serin Wireless, N2400, ("t"), SignBit, Quotient, Fract, Humidity, HFract, b15, b15 ; Flash "telltale" on LCD to indicate activity and successful "serin" from wireless. gosub telltale; Display first group on LCD hserout 0, ("acc0", 13) hserout 0, ("ad", SignBit, #Quotient, ".", #Fract, " ", 13) hserout 0, ("acce", 13) hserout 0, ("ad", #Humidity,".", #HFract, " ", 13) gosub switches ; Send first group to computer COM port ; Each group has a start identifier, data and an end identifier: ; Start = "xS", End is "xE" eg Wind Start is WS, Wind End is WE ; Multiple data are separated by a single space character. serout Computer, N2400, ("TS", SignBit, #Quotient," ", #Fract, "TE") ; Temperature serout Computer, N2400, ("HS", #Humidity, " ", #HFract, "HE" ); Humidity ; Check switches again and at regular intervals throughout the program. gosub switches ; Get second group of values from outdoor unit radio link. serin Wireless, N2400, ("m"), DirHi, DirLo, SpeedHi, SpeedLo, RainCountLastHour, RainCountThisHour, b15 gosub telltale Speed = Speed * 300 / 448 ; Estimated conversion from pulses/sec to mph Dir = Dir * 64 / 182 ; Convert 0 - 1023 to 0 - 359 degrees ; To preserve precision, rain gauge has to be calibrated by adjusting the ; mechanical stops on the tipping bucket so that 1 tip is 0.5 mm of rain. if LastOrThis = "c" then ; Decide whether to display previous hour"s LCDRainWhole = RainCountThisHour / 2 ; rainfall or the current hour"s. LCDRainFract = RainCountThisHour * 5 // 10 else LCDRainWhole = RainCountLastHour / 2 ; LCDRainFract = RainCountLastHour * 5 // 10 endif ; Send second group to LCD hserout 0, ("ac95", 13) hserout 0, ("ad", #Dir, " ", 13) hserout 0, ("ac9c", 13) hserout 0, ("ad", # Speed, " ", 13) hserout 0, ("aca1", 13) hserout 0, ("ad", LastOrThis, " ", #LCDRainWhole, ".", #LCDRainFract, " ", 13) ; Send second group to computer COM port serout Computer, N2400, ("WS", #Dir," ", #Speed, "WE") ; Wind serout Computer, N2400, ("RS", #RainCountLastHour," ", #RainCountThisHour, "RE" ); Rain gosub switches ; Thanks to "matherp" on the Picaxe forum for the mbar code loop: ; Measuring atmosperic pressure with a MPX4115A ; Analogue to digital conversion using a MCP3422 ; MPX output to V+, 2. 5V to V- ; ADC in 16 bit mode hi2cin (b1,b0,b2) ; Read in the ADC reading and the status byte from MCP3422 adj1 = 0 adj2 = 0 w1 = mb900 mbar = 900 do while mBarADCValue > w1 ; mBarADCValue = w0 = b1:b0 inc mbar w1 = w1 + adj0 inc adj1 if adj1 = 4 then inc adj2 w1 = w1 + 1 adj1 = 0 endif if adj2 = 6 then w1 = w1 + 1 adj2 = 0 endif loop gosub switches gosub telltale; Send pressure to computer COM port serout Computer, N2400, ("PS:", #mbar, "PE") ; Initialize previous pressure reading (lastmbar) if not already set if lastmbar = 0 then lastmbar = mbar RiseFall = " " endif ; Display up arrow or down arrow if pressure has changed if mbar > lastmbar then RiseFall = "^" ; ^ lastmbar = mbar endif if mbar< lastmbar then RiseFall = 10 ; Custom LCD character. Down arrow lastmbar = mbar endif hserout 0, ("acc7", 13) hserout 0, ("ad", RiseFall, #mbar, " ",13) gosub telltale goto main ; Check if one of the front panel buttons is pressed. switches: if LCD = 1 then ; LCD Backlight on/off Button is pressed if LCD_Status = 0 then ; Backlight is on so... hserout 0, ("ab0", 13) ; Turn it off LCD_Status = 1 else hserout 0, ("ab1", 13) ; Else turn it on. LCD_Status = 0 endif do: loop while LCD = 1 ; Don"t return while button is pressed endif if ClearRiseFall = 1 then ; Pressure rise/fall button is pressed RiseFall = " " ; Clear indicator and... hserout 0, ("acc7", 13) ; ... update display. hserout 0, ("ad", RiseFall, #mbar, " ",13) do: loop while ClearRiseFall = 1 endif if LastOrThisSwitch = 1 then ; Rain Previous Hour / Last Hour button. if LastOrThis = "c" then LastOrThis = "p" LCDRainWhole = RainCountLastHour / 2 ; Recalculate values and re-display to LCDRainFract = RainCountLastHour * 5 // 10 ; give visual confirmation of button-press else LastorThis = "c" LCDRainWhole = RainCountThisHour / 2 ; LCDRainFract = RainCountThisHour * 5 // 10 endif hserout 0, ("aca1", 13) hserout 0, ("ad", LastOrThis, " ", #LCDRainWhole, ".", #LCDRainFract, " ", 13) do: loop while LastOrThisSwitch = 1 endif return ; Flash "tell-tale" on LCD display to show activity telltale: if active = "*" then active = " " else active = "*" endif hserout 0, ("ac80", 13, "ad", active, 13) returnMemory used = 764 bytes out of 2048
PC software

The software that runs on the PC was written using Borland Delphi 7. It's pretty primitive in its current form, but it at least shows the connection between the Picaxe and the computer.
Graphs can be selected to be displayed in a 1 hour or 12 hour period. Graphs can be scrolled back and forth with the mouse. They can be saved. To do this, right-click on them and specify the name and value file. You can set up a limited set of APRS data that is written once per minute per line of the APRS.TXT file and stored in the same folder as Weather.exe. Note that temperatures are in degrees Fahrenheit and rainfall is in 1/100ths per inch.
List of radio elements
| Designation | Type | Denomination | Quantity | Note | Shop | My notepad | |
|---|---|---|---|---|---|---|---|
| Temperature and relative humidity sensor | |||||||
| temperature sensor | DS18B20 | 1 | To notepad | ||||
| Humidity sensor | HIH-3610 | 1 | To notepad | ||||
| Resistor | 4.7 kOhm | 1 | To notepad | ||||
| Wind speed and direction meter | |||||||
| Phototransistor | IR | 1 | To notepad | ||||
| Light-emitting diode | IR | 1 | To notepad | ||||
| Resistor | 220 ohm | 1 | To notepad | ||||
| Resistor | 4.7 kOhm | 1 | To notepad | ||||
| Magnetic encoder | 1 | To notepad | |||||
| electrolytic capacitor | 10 uF | 4 | To notepad | ||||
| Capacitor | 100 nF | 1 | To notepad | ||||
| Resistor | 4.7 kOhm | 1 | To notepad | ||||
| Resistor | 10 kOhm | 1 | To notepad | ||||
| Precipitation meter | |||||||
| MK PICAXE | PICAXE-08M | 1 | To notepad | ||||
| rectifier diode | 1N4148 | 2 | To notepad | ||||
| Capacitor | 100 nF | 1 | To notepad | ||||
| Resistor | 4.7 kOhm | 1 | To notepad | ||||
| Resistor | 10 kOhm | 4 | To notepad | ||||
| Resistor | 22 kOhm | 1 | To notepad | ||||
| Resistor | 220 ohm | 2 | To notepad | ||||
| Light-emitting diode | IR | 1 | |||||